Hypothesis/Variables/Problem
advertisement
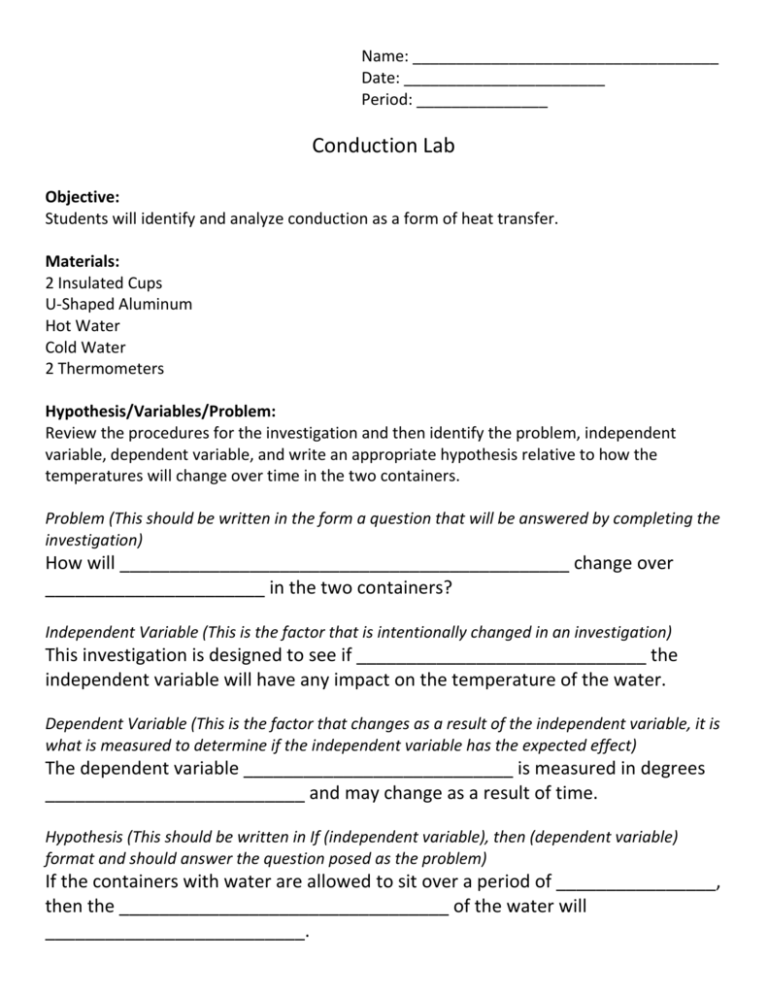
Name: ___________________________________ Date: _______________________ Period: _______________ Conduction Lab Objective: Students will identify and analyze conduction as a form of heat transfer. Materials: 2 Insulated Cups U-Shaped Aluminum Hot Water Cold Water 2 Thermometers Hypothesis/Variables/Problem: Review the procedures for the investigation and then identify the problem, independent variable, dependent variable, and write an appropriate hypothesis relative to how the temperatures will change over time in the two containers. Problem (This should be written in the form a question that will be answered by completing the investigation) How will _____________________________________________ change over ______________________ in the two containers? Independent Variable (This is the factor that is intentionally changed in an investigation) This investigation is designed to see if _____________________________ the independent variable will have any impact on the temperature of the water. Dependent Variable (This is the factor that changes as a result of the independent variable, it is what is measured to determine if the independent variable has the expected effect) The dependent variable ___________________________ is measured in degrees __________________________ and may change as a result of time. Hypothesis (This should be written in If (independent variable), then (dependent variable) format and should answer the question posed as the problem) If the containers with water are allowed to sit over a period of ________________, then the _________________________________ of the water will __________________________. Procedure: 1. Connect the two containers by inserting the ends of the aluminum bar into the large slots in the two lids. Press the bar all the way down. 2. Place thermometers into the small slots in both of the two lids. 3. Fill the Cold water cup with cold water to one centimeter from the top. 4. Fill the Hot water cup with hot water to one centimeter from the top. Quickly and carefully place the lid on both cups at the same time. See figure below: Metal Bar Thermometer Insulated Cups Hot Water Cold Water 5. Let the cups sit for 1-2 minutes until the hot cup thermometer stops changing. Then record the starting temperature for each cup. 6. Record the temperature in each container for 16 minutes, at one minute intervals. 7. After recording the data for five minutes, touch the bar and note observations. 8. Record the control data (no bar) from data chart provided by the teacher. 9. Complete graphical analysis of the data. a. Graph the results, with temperature as the dependent variable (vertical axis) and time as the independent variable (horizontal axis). b. Use a red line for the hot water data and a blue line for the cold water. c. Remember to use TAILS in constructing your graph. 10. Complete the questions and conclusion based on the instructions that follow. *Data: Bar at five minutes is: ____________________________________________________ Temperature (0C) Cups 1 2 3 4 5* 6 7 8 9 10 11 12 13 14 15 16 Control (No Bar) Connected with Metal Bar Difference Hot Cold Questions: 1. What was the temperature difference in the hot water cup? Highest Temperature – Lowest Temperature =Temperature Difference __________________ - ____________________ = _________________________ 2. What was the temperature difference in the cold cup? Highest Temperature – Lowest Temperature =Temperature Difference __________________ - ____________________ = _________________________ 3. Which cup lost the most heat energy? Which gained the most heat energy? How do you know? The ______________________ water cup lost the most energy because the temperature _________________________ the most. The ______________________ water cup gained the most energy because the temperature _________________________ the most. This can be determined by subtracting the ______________________ temperature from the ______________________ temperature. 4. Did the amount of heat energy lost by one cup equal the heat energy gained by the other one? If not, explain where the lost heat went. One cup had a temperature difference of _______________ degrees and the other cup had a difference of _________________ degrees. Since these numbers are ___________________ heat was ____________________________________. 5. In which direction did heat apparently flow between the two containers (hotcold or coldhot)? __________________________________________________________________________ __________________________________________________________________________ 6. Which method of heat transfer took place between the cups? Explain your response. ______________________________ took place because the aluminum bar __________________________________________________________________________ __________________________________________________________________________ __________________________________________________________________________ 7. Base on your observations, where was the most heat lost? (Hint: Where did you feel the heat being lost?) The most heat was lost ___________________________________________________ because ___________________________________________________________________ __________________________________________________________________________ 8. Determine at least one way you could reduce the amount of heat lost in this lab. How does this relate to the design of your house? __________________________________________________________________________ __________________________________________________________________________ __________________________________________________________________________ __________________________________________________________________________ Analysis: Label: (This should be of the format Dependent Variable (Units)): _______________________________________________ Title (This should follow a format of dependent vs. independent) ___________________________________________________________ 100 96 92 88 84 80 76 72 68 64 60 56 52 48 44 40 36 32 28 24 20 16 12 8 4 0 0 1 2 3 4 5 6 7 8 9 10 11 12 13 14 15 16 Label: (This should be of the format Independent Variable (Units)): _______________________________________________ Conclusion: Write a conclusion for the lab which includes the following parts: Restate the purpose for doing the experiment. Restate your hypothesis and whether it was correct or incorrect. Summarize and analyze your data. Discuss trends and reasons for the trends. Be sure to cite your data. Discuss how what you have learned in this experiment may apply outside the lab; for example, in reducing energy costs in your home. This experiment was completed in order to determine if the __________________ _________________________ was able to transfer _________________________ from a container with ____________________ ______________________ to a container with ____________________ ______________________. They hypothesis stated that if _______________________________________________ , then______________________________________________________________. The hypothesis was proven to be _________________________________ during the experiment. The data showed that energy moved from the ____________________ ______________________ to the ____________________ ______________________ because the temperature decreased by _______________ degrees in the _____________ container. The temperature increased by __________________ degrees in the _________________ container. When the graph is examined the lines look like they are ______________________ of one another, one goes __________________________ while the other goes ____________________________. It seems as though some energy was ________________________ since the temperature difference between the two containers was not the ______________. This may have been caused by __________________________________________. It would be important to consider heat loss when building a house because ___________________________________________________________________ __________________________________________________________________.
