Indexing XRD-patterns, getting cell parameters
advertisement
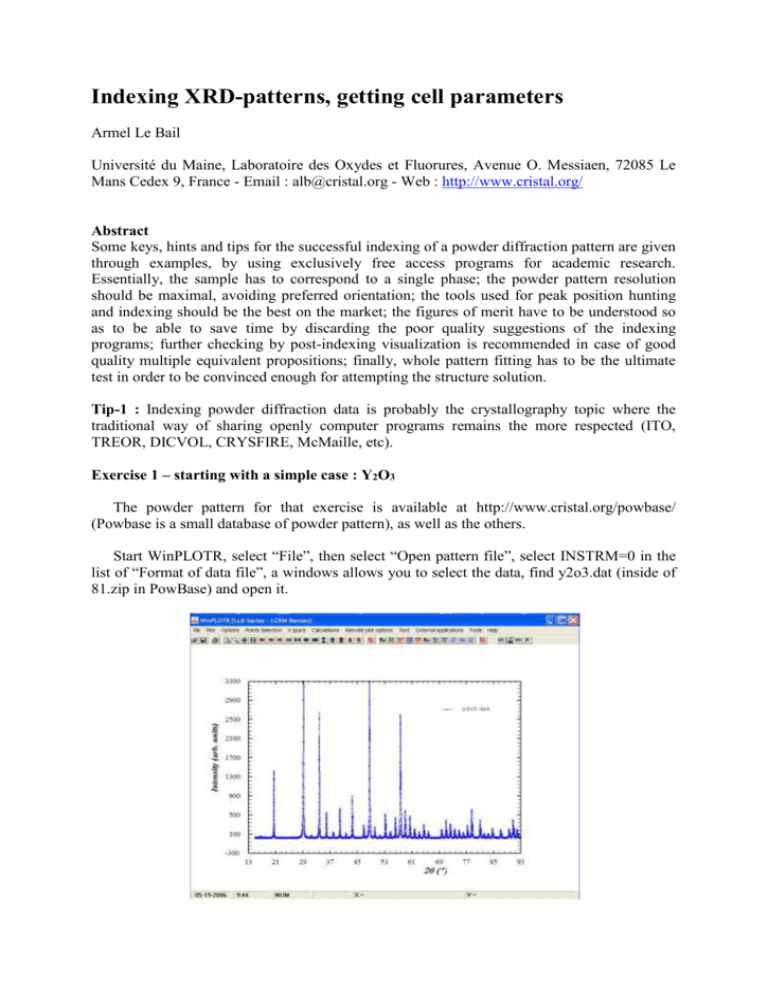
Indexing XRD-patterns, getting cell parameters Armel Le Bail Université du Maine, Laboratoire des Oxydes et Fluorures, Avenue O. Messiaen, 72085 Le Mans Cedex 9, France - Email : alb@cristal.org - Web : http://www.cristal.org/ Abstract Some keys, hints and tips for the successful indexing of a powder diffraction pattern are given through examples, by using exclusively free access programs for academic research. Essentially, the sample has to correspond to a single phase; the powder pattern resolution should be maximal, avoiding preferred orientation; the tools used for peak position hunting and indexing should be the best on the market; the figures of merit have to be understood so as to be able to save time by discarding the poor quality suggestions of the indexing programs; further checking by post-indexing visualization is recommended in case of good quality multiple equivalent propositions; finally, whole pattern fitting has to be the ultimate test in order to be convinced enough for attempting the structure solution. Tip-1 : Indexing powder diffraction data is probably the crystallography topic where the traditional way of sharing openly computer programs remains the more respected (ITO, TREOR, DICVOL, CRYSFIRE, McMaille, etc). Exercise 1 – starting with a simple case : Y2O3 The powder pattern for that exercise is available at http://www.cristal.org/powbase/ (Powbase is a small database of powder pattern), as well as the others. Start WinPLOTR, select “File”, then select “Open pattern file”, select INSTRM=0 in the list of “Format of data file”, a windows allows you to select the data, find y2o3.dat (inside of 81.zip in PowBase) and open it. Tip-2 : The file y2o3.dat is a text file. Lines starting by ! or # are ignored by WinPLOTR. The data format corresponding to INSTRM=0 corresponds to a line with starting angle, step and last angle in degrees 2, then follow the intensities step by step in free format : 15.00 0.01 145.90 25 22 26 21 19 20 17 27 19 22 ………..etc 37 33 64 53 150 203 695 762 1363 1242 384 300 107 82 55 51 32 28 29 17 19 24 20 18 22 21 22 16 30 28 19 33 14 21 19 14 26 17 21 19 23 15 22 21 13 25 21 21 18 30 44 72 238 918 1095 205 64 45 39 23 48 80 256 1005 1027 199 67 47 27 24 55 87 316 1263 837 158 42 36 22 18 46 122 386 1372 761 121 68 31 35 23 61 150 453 1416 587 123 62 31 25 26 48 142 557 1398 506 109 59 43 29 29 At this stage you are expected to make use of your crystallography expertise already. You must answer to the question : high or low symmetry ? Clearly, just by looking at the pattern, there are evidences for a high symmetry because of the quasi constant angular interval between the peak positions. Keep that possibility in mind. Then click on “Points selection”, and “Automatic peak search”, select “Search Cu K1 K2 doublets” (yes, this is conventional laboratory X-ray data without any monochromator in the incident beam). Click on “OK”, the result is 21 peaks found if the range goes up to 93°(2). Clearly, many peaks with small intensity were not identified. Go back to “Points selection”, and “Automatic peak search”, and change the “peak threshold” to 0.005 instead of 0.02, click on OK, that time 38 peaks are detected, click OK. Even if some very small peaks are not taken into account, we can try now to index. Click again on “Points selection”, then on “save as”, then on “Save points for McMaille” (what were you expecting, I am the author of McMaille ;-): Then a box is opened, type a title (why not Y2O3), give the wavelength (1.54056, yes this is K1 only now) and let the zeroshift to be 0, click OK, the program says that a file named y2o3_mcmy.dat has been created, click OK and quit WinPLOTR. Here is the y2o3_mcmy.dat file content : Y2O3 ! Wavelength, zeropoint and NGRID (NGRID=3: black box mode) 1.540560 0.000 3 ! List of 2theta positions, intensity (min.=20) 20.50481 1411.71155 29.15784 11198.95700 33.79123 2632.66553 35.91046 531.02966 37.92135 135.21042 39.84880 606.23480 41.70092 118.49068 43.48877 881.15845 46.88918 271.40564 48.52835 4213.47021 50.12016 230.08562 51.68559 66.62399 53.20726 506.43854 54.69715 56.16987 57.61465 59.03540 60.43375 61.81146 Etc 117.27492 404.76215 2603.39868 563.80334 471.21359 194.23712 Copy that file inside of the directory where McMaille is installed and start this indexing program (click on “McMaille.exe, and give the file name without extension: y2o3_mcmy) : Tip-3 : You will probably not obtain exactly this result, because McMaille uses a Monte Carlo algorithm, implying a sequence of pseudo-random number. You would obtain the same result if you start exactly at the same point in that sequence. The starting point is defined in McMaille by the time (expressed in seconds since the beginning of the day) at the instant when you start the program. At least you should obtain a similar result in a different order. Let us comment these results. McMaille is working in the so-called “black box mode”. We have given only very few informations : peak positions, intensities, wavelength, a null zeropoint (this is a constant – an approximation - angular shift due to both instrumental – if misaligned - and sample – if not in the diffracting plane – effects that we should not neglect in the next exercises). In that black box mode, McMaille follows its own strategy : testing first the highest symmetries, down to triclinic, inside of some predetermined limits of cell parameters and volumes. Tip-4 : All indexing programs have such maximal default values which the user has to know – see the manuals - and should modify if no result is obtained. The essential things to see in the output file of any indexing program are the FoMs (Figures of Merit), generally noted M20 and F20 or F30. The higher are these FoMs, the more the corresponding cells are plausible. For the definitions of the FoMs, see the excellent chapter 7, autoindexing, written by Per-Erik Wernet in the book “Structure Determination from Powder Diffraction Data. Tip-5 : References are at the end of the tutorial McMaille provides also these FoMs for selected good cells, but the solutions are sorted according to a somewhat different criterion noted Rp which is equivalent to a Rietveld profile reliability. The program will not always stop like it has done here, it may well examine all symmetries down to triclinic. In black box mode, it will stop if a solution with Rp < 0.02 is found. In that case, it has found an orthorhombic solution with Rp = 0.013 with a very small cell volume (149 Å3) and very large conventional FoMs (M20 = 280). A very small Rp value (< 0.05) means that the powder pattern is well fitted, the smaller will be Rp, the larger will be the conventional FoMs M20 and F20. But is it the good cell ? Tip-6 : The ultimate decision has to be made by the user, always… Having a good formation in crystallography will help a lot to make the decision. In that case, solutions with small Rp are also proposed in cubic (R = 0.032), hexagonal (R = 0.038) and tetragonal (R = 0.023). Tip-7 : First important point to keep in mind for becoming an expert in indexing : any cell with a high symmetry can also be indexed in all the lower symmetries. In that case, if McMaille had not stopped at the orthorhombic symmetry, it would have provided cells also in monoclinic and triclinic symmetries, possibly with even lower Rp values. Are all lines indexed ? In black box mode, whatever the number of lines given, McMaille will work only by using the first 20 lines, and has a tolerancy of 3 unindexed lines. The number of not indexed lines is provided (parameter Nind in the figure above). All lines are indexed in cubic, tetragonal and orthorhombic (Nind = 0). Making the ratio Vcubic/Vortho gives 1192/148 = 8… So, very probably, the cell is cubic. McMaille prepares a new .dat file for further investigations in manual mode. That file name is y2o3_mcmy-new.dat. Edit that file : Y2O3 ! Wavelength, zeropoint, Ngrid 1.540560 0.0000 0 ! Codes for symmetry 1 0 0 0 0 0 ! W, Nind 0.300 3 !Pmin, Pmax, Vmin, Vmax, Rmin, Rmax, Rmaxref 2. 20. 8. 2000. 0.05 0.25 0.50 ! Ntests, Nruns 2000 1 ! 2-theta Intensity 20.50481 1411.712 29.15784 11198.96 33.79123 2632.666 35.91046 531.0297 37.92135 135.2104 39.84880 606.2348 41.70092 118.4907 43.48877 881.1584 46.88918 271.4056 48.52835 4213.470 50.12016 230.0856 51.68559 66.62399 53.20726 506.4385 54.69715 117.2749 56.16987 404.7621 57.61465 2603.399 59.03540 563.8033 60.43375 471.2136 61.81146 194.2371 63.17843 149.1199 64.53022 288.8621 65.85427 145.6454 69.78623 190.6706 Cubic only Decrease some values here If you read the manual (don’t believe you can become an expert in 2 hours…) you will see that that file is configured for a search only in cubic, just fine, this is what we want to do. Apply again McMaille to that file : Have a look inside of the y2o3_mcmy-new.imp file containing the detailed results : FINAL VALUES : (STANDARD DEVIATIONS : 2nd LINE) ZERO LAMBDA -0.014 1.5406 0.001 0.0000 RECIPROCAL CELL : VOLUME (A**3) : H K L 2 2 4 4 4 3 4 4 5 4 4 4 6 6 5 6 6 4 7 6 6 6 1 2 0 1 2 3 2 3 2 4 3 4 1 2 4 2 3 4 1 4 3 4 1 2 0 1 0 2 2 1 1 0 3 2 1 0 1 2 1 4 0 0 3 2 A B C 10.6059 10.6059 10.6059 0.0003 0.0003 0.0003 0.09429 0.09429 0.09429 1193.017 TH(OBS) 20.505 29.158 33.791 35.910 37.921 39.849 41.701 43.489 46.889 48.528 50.120 51.686 53.207 54.697 56.170 57.615 59.035 60.434 61.811 63.178 64.530 65.854 TH-ZERO 20.491 29.144 33.777 35.897 37.907 39.835 41.687 43.475 46.875 48.514 50.106 51.672 53.193 54.683 56.156 57.601 59.022 60.420 61.798 63.165 64.516 65.840 ALPHA 90.000 0.000 90.000 TH(CALC) 20.495 29.143 33.777 35.893 37.907 39.833 41.685 43.472 46.881 48.515 50.110 51.668 53.193 54.688 56.157 57.600 59.021 60.421 61.801 63.165 64.511 65.843 BETA 90.000 0.000 90.000 DIFF. -0.004 0.001 0.000 0.003 0.001 0.002 0.002 0.003 -0.006 -0.001 -0.003 0.004 0.000 -0.005 -0.001 0.001 0.001 -0.001 -0.004 0.000 0.005 -0.003 GAMMA 90.000 0.000 90.000 7 8 5 8 6 6 7 6 8 8 8 6 7 7 8 9 M(20) = F(20) = 3 0 5 2 5 6 4 6 4 3 4 5 5 6 4 4 2 0 4 0 3 0 3 2 0 3 2 5 4 3 4 1 69.786 71.059 72.331 73.591 74.859 76.097 77.347 78.580 81.036 82.255 83.480 84.689 87.115 89.529 90.747 91.955 168.09 151.03 ( 0.0021, 69.772 71.045 72.318 73.577 74.845 76.083 77.333 78.566 81.022 82.241 83.466 84.675 87.101 89.515 90.733 91.941 69.761 71.044 72.318 73.582 74.839 76.087 77.330 78.566 81.023 82.244 83.463 84.678 87.102 89.521 90.730 91.940 0.011 0.001 0.000 -0.006 0.006 -0.004 0.004 0.000 0.000 -0.003 0.003 -0.004 -0.001 -0.006 0.003 0.001 62) This looks extremely good. Will any attempt be that easy ? Certainly not… this was the first exercise and you are lucky. McMaille prepares a file for a Rietveld-like fit (a .prf file) for the best solution which you can see by using WinPLOTR. Let us see that y2o3_mcmy-new.prf file. Start WinPLOTR, click on “File”, then on “Open Rietveld/profile file”, select “101 : Fullprof PRF file”, click on OK, and select the file in the Windows box. The vertical bars note all lines that should be there. A lot are lacking. You may realize, by examining the hkl indices of the indexed lines that there is a systematic relation h + k + l = 2n, and thus the Bravais lattice is very probably I – centered. McMaille will not do that automatically for you. Tip-8 : Some programs perform automatically everything (indexing, space group suggestion, solving the structure, refining, etc), like EXPO2006 : use these programs first, and if they fail, go back to some standalone programs. Tip-9 : Only solving the structure confirm the indexing… but this is not the scope of this tutorial. Tip-10 : you should never try to index without having defined the zeropoint… Exercise 2 – A bit more difficult : -AlF3 Software for hunting the peak positions are numerous (see session 2 of the SDPD Internet Course : http://sdpd.univ-lemans.fr/DU-SDPD/), free access (WinPLOTR, PowderX, EXPO2004, etc) or commercial (EVA, Highscore, Jade, etc). Let us try PowderX on the -AlF3 powder pattern. In fact the pattern is corrected for a large zeropoint error (0.3° !) due to the fact that the sample was dusted on the sample holder for avoiding preferred orientation. Tip–11 : Dusting a sample on the holder through a sieve allows for reducing preferred orientation effects. But since this enlarges the peak width, it is not recommended at the indexing stage : press the sample for a better resolution. Tip-12 : Typical excellent minimal FWHMs (Full Width at Half Maximum) are (for well crystallized compounds) : 0.04 to 0.06°(2) for conventional laboratory instrument and 0.005 to 0.01°(2) for third generation synchrotron source. Note that a 0.02° FWHM at a synchrotron source with a 0.7 Å wavelength is equivalent to 0.04° in your lab with a copper target… Tip-13 : The zeropoint correction can be done before indexing by two methods : mixing a reference compound with the sample or using the harmonics technique. Let us consider that you know how doing these “simple” things. If not, see sessions 2 and 3 of the SDPD Internet Course. The -AlF3 powder pattern is also available in PowBase (1.dat inside of 1.zip), and can be read with PowderX by clicking on “File”, then “Import Data”, then “RIET7” for the format. This is a format analogous to the one read by WinPLOTR (INSTRM=0), but you have to add 4 header lines (blank if you wish). First remove the background : click on “Substract Background” then on “Show” in the small box and the on “OK” if you are satisfied (otherwise play with the options, and zoom to see the effect). Click on “Alpha2 Elimination”, click on “Test”, click on “Finish”. Click on “Peak Search”, then on “Show”, modify the intensity limit for the detection of the weakest peaks if you wish, then click on OK. Save the file after confirmation of the wavelength : 2Theta 12,292 15,040 17,358 21,324 23,056 24,656 25,039 26,272 26,632 26,748 27,634 27,936 29,023 29,240 29,401 29,729 30,394 34,038 35,239 36,355 37,523 39,501 40,567 d (A) 7,19449 5,88588 5,10448 4,16331 3,85441 3,60768 3,55334 3,38940 3,34432 3,33017 3,22529 3,19114 3,07407 3,05179 3,03544 3,00260 2,93842 2,63177 2,54473 2,46914 2,39493 2,27942 2,22199 Height 336,0 18391,1 19047,3 47804,6 38529,0 11816,5 5890,4 28732,0 408,5 290,9 52845,1 644,3 25452,0 943,2 284,2 337,7 8950,3 1399,2 698,6 1346,2 1679,4 2415,3 3282,1 Area FWHM 1262,2 0,0800 147126,3 0,1600 144454,3 0,1600 323420,4 0,1400 268961,3 0,1400 82581,7 0,1400 54511,0 0,2000 227980,7 0,1600 1447,7 0,0800 1085,7 0,0800 474146,2 0,1800 2064,0 0,0800 203382,7 0,1600 3265,4 0,0800 1420,5 0,1000 1909,7 0,1200 71150,3 0,1600 11181,9 0,1600 4946,1 0,1600 10729,8 0,1600 12700,5 0,1600 16903,5 0,1400 22194,2 0,1400 41,526 2,17285 1868,9 14926,1 0,1600 Tip-14 : You may also play with the zeropoint correction system inside of PowderX. Then save the file for TREOR and transform it into a file for McMaille ;-). You have to change the comma into points and remove the stuff at the end of the file, rename it as AlF3.dat in the McMaille directory. Tip-15 : When using PowderX, be carefull that the wavelength was taken into account, otherwise use only 2 values, but not d(Å) values. AlF3 1.54056 0 3 12.292 15.040 17.358 21.324 23.056 24.656 25.039 26.272 26.632 26.748 27.634 27.936 29.023 29.240 29.401 29.729 30.394 34.038 35.239 36.355 37.523 39.501 40.567 41.526 43.515 44.450 44.727 46.241 46.523 47.176 47.480 49.878 6 348 360 905 729 224 111 544 8 6 1000 12 482 18 5 6 169 26 13 25 32 46 62 35 36 195 8 145 10 251 9 38 Remove Remove Remove Remove Remove Remove Remove those weak peaks with intensity < 1% of the most intense one (maybe leaving the first at low angle). Tip-16 : Peaks at low angles are essential even if they are weak. Start McMaille and see the results. Cells with R close to 5% appear in tetragonal, orthorhombic, monoclinic, you may stop the calculation by typing K (large character), and then think… Which cell is the good one ? Again there are several possibilities. Remember that any high symmetry cell can be proposed in a lower symmetry. In that case, the tetragonal cell with smallest volume seems to have chances to be the correct one. McMaille produces files with .ckm extension which can be read by the Chekcell program and may help to decide. The AlF3.ckm file : N FoM 17 17 17 17 18 17 18 17 17 17 17 17 17 17 93.28 87.55 87.52 86.81 86.00 85.14 84.59 83.63 82.55 80.76 80.52 79.36 76.28 75.64 V V/V1 374.247 1.00 748.954 2.00 379.961 1.02 374.340 1.00 379.919 1.02 374.347 1.00 1123.379 3.00 374.484 1.00 502.511 1.34 308.628 0.82 441.141 1.18 308.588 0.82 1119.785 2.99 354.395 0.95 7.1866 10.2023 5.1844 11.4104 5.1843 10.2026 15.3210 5.1070 7.6607 4.2084 7.3487 4.2083 12.4887 7.2113 10.2015 5.1047 90.000 90.047 90.000 10.2141 7.1872 90.000 90.000 90.000 10.1684 7.3235 90.000 100.212 90.000 7.1869 5.1053 90.000 116.603 90.000 10.1677 8.1882 90.000 118.331 90.000 7.1867 5.1054 90.000 90.030 90.000 7.1867 10.2026 90.000 90.000 90.000 7.1872 10.2025 90.000 90.000 90.000 10.1696 6.8487 90.000 109.642 90.000 10.2036 7.8445 90.000 113.620 90.000 10.1996 6.0087 90.000 101.627 90.000 10.2022 7.2651 90.000 98.381 90.000 8.7879 10.2032 90.000 90.000 90.000 10.2017 4.8337 90.000 94.722 90.000 17 19 17 17 17 20 18 18 19 18 17 17 17 17 75.53 75.35 74.57 73.60 72.48 72.46 68.96 68.34 67.56 67.31 64.36 63.96 63.92 63.25 338.952 0.91 1831.669 4.89 338.922 0.91 502.352 1.34 2995.752 8.00 2995.731 8.00 336.200 0.90 371.538 0.99 1208.311 3.23 470.527 1.26 429.930 1.15 362.825 0.97 748.935 2.00 338.099 0.90 4.6103 10.2002 7.3041 90.000 99.319 90.000 14.3750 12.4897 10.2020 90.000 90.000 90.000 7.9813 10.1991 4.6105 90.000 115.436 90.000 7.6535 10.1970 6.8273 90.000 109.471 90.000 14.4370 14.4370 14.3732 90.000 90.000 90.000 10.2086 10.2086 28.7457 90.000 90.000 90.000 7.9158 10.2015 4.5834 90.000 114.722 90.000 10.1685 5.1044 7.1584 90.000 90.522 90.000 14.2227 10.2029 8.3267 90.000 90.000 90.000 6.4170 10.2025 7.4635 90.000 105.645 90.000 7.2975 10.2033 5.8628 90.000 99.978 90.000 4.9471 10.2019 7.1966 90.000 92.649 90.000 10.2085 10.2085 7.1865 90.000 90.000 90.000 7.3083 10.1965 4.6008 90.000 99.549 90.000 Most of the cells with the highest FoMs have volumes multiple of 374 Å3. Start Chekcell. Click on “File”, then “Open”, then “Diffraction Data File”, then “Rietveld Format”, specify the wavelength when asked by the program, the pattern should appear (the data file must have 4 header lines), zoom eventually. Then, open the .ckm file : click on “File”, “Open”, “Cell File”, “Crysfire Summary File”, search for the .ckm option and select it, find AlF3.ckm (note that sub-files for different symmetries are also built up by McMaille) : There is a chance that the cell would be tetragonal with cell parameters a = 10.2 and c = 7.2 Å. One intense impurity line is obvious (this is -AlF3). Tip-17 : Whole profile fitting (Pawley of Le Bail methods) would provide the ultimate convincing arguments (a perfect fit…) and allow to decide for some space group possibilities. Exercise 3 – C28H24O8 synchrotron data - Even more difficult ? The powder pattern for that sample is also inside of PowBase (see 89.dat in 89.zip). Let us come back to WinPLOTR for the peak position extraction. Wavelength : = 1.15023 Å. Tip-18 : in principle, synchrotron data corresponds to parallel beamline so that there is no zeropoint. In practice, but verify… Use the automatic peak search option as in the exercise 1, decrease the peak threshold to 0.005 in order to locate some of the weakest peaks and save the file for McMaille : Start McMaille, and during the calculations, save also the results for TREOR : Do not forget to change the wavelength and increase the limit of the FoM to 50 : this is synchrotron data, you may expect high FoMs. ! DATA FILE: 89.dat ! INSTRM: 0 C28H24O8 4.98193 3286.80762 9.99003 1472.15564 11.83465 4172.48730 14.26077 5120.27832 83.30889 57.64410 66.85038 132.29897 14.54244 2541.02197 127.71822 14.68000 2377.54810 114.03048 15.01395 1603.88196 96.83777 15.67321 402.99741 105.96571 16.43242 187.91476 106.60686 18.40516 320.04770 157.74744 18.57075 10253.10740 161.52725 18.81269 205.76633 155.59302 20.06825 933.78021 125.71569 21.49577 1768.68835 149.90627 21.70489 2902.25244 157.81589 21.89608 637.32843 155.65938 22.13791 1497.10925 137.45313 22.80752 548.14728 116.36189 22.90763 345.16406 117.80325 23.72424 243.58403 108.58457 24.44472 301.27338 99.54028 24.98247 252.92178 90.35323 26.37432 219.01628 82.18118 28.60269 157.93480 75.28192 28.76217 303.62329 73.10251 29.97874 350.80719 71.17887 30.52339 490.87183 83.80813 30.69416 222.56485 81.57237 32.01038 431.36816 96.65090 32.23336 385.18842 92.53907 32.98502 394.52618 82.19423 33.36611 675.33411 80.25625 33.97608 144.84073 73.54704 CHOICE=3, WAVE= 1.15023, MONO=125.00, VOL= 1500., CEM= 20., MERIT= 50., END* Maybe there are too much data. Tip-19 : generally, the first 20 lines of a powder pattern are sufficient for indexing. Using more may even obscure the results… And run TREOR inside of WinPLOTR : Inside of WinPLOTR, TREOR produces also files for CHEKCELL. Tip-20 : the statement ***** YOU HAVE GOT AN INTERESTING RESULT !!! ***** is given only if M(20) is better than your specifications, generally it announces a correct solution. Tip-21 : TREOR runs much faster than McMaille… It is better to apply it first. Now go back to the McMaille screen, and stop the calculations by typing K (capital letter). Maybe it had enough time to find that monoclinic solution as well ? Exercise 4 – Tetracycline Hydrochloride – Synchrotron data Use the file tetrasync.dat in PowBase (download 17.zip) with wavelength : = 0.692 Å. This is a capillary measurement (explaining the amorphous component). Let us try again WinPLOTR : Let us save the data for DICVOL04 : Tip-22 : DICVOL04 is generally much faster than McMaille but is a bit longer than TREOR for low symmetries (monoclinic and triclinic), in general, so, start with TREOR, then DICVOL04, then McMaille, then CRYSFIRE. Tip-23 : Using first TREOR and DICVOL can be sufficient and convincing enough for not applying any other indexing software. # Input file for WDICVOL04 (created by WinPLOTR) # created by WinPLOTR: 22-05-2006 at 14:40:39 ! DATA FILE: tetrasync.dat ! INSTRM: 0 Tetracycline Hydrochloride 20 2 1 1 1 1 1 0 ! N,ITYPE,JC,JT,JH,JO,JM,JTR 25.0 25.0 25.0 0.0 2500.0 90.0 125.0 ! AMAX, BMAX, CMAX, VOLMIN, VOLMAX, BEMIN, BEMAX 0.69200 0.000 0.000 0.000 ! WAVE,POIMOL,DENS,DELDEN 0.030 20.000 3 0 1 1 ! EPS,FOM, N_IMP, ZERO_search, ZERO_refinement, ISUP 3.98593 36431.48050 10162.20610 4.40658 41888.94530 10565.47270 4.75146 29037.62700 11002.17770 5.04268 65646.02340 11368.10350 5.38045 33498.84770 11182.45120 5.91553 28324.10940 11602.85940 6.20306 50488.21090 12065.03910 6.67000 17883.95510 12214.81350 6.93070 43182.59770 13354.95020 7.15491 77665.66410 13321.50490 7.58623 38302.71090 13787.45120 7.97693 15808.31350 14298.10740 8.25668 41806.14060 14822.07620 8.75711 36411.66410 17468.19530 8.93881 53459.96480 17769.21090 9.34233 49226.54300 18679.95310 9.51136 26989.77340 19966.95310 9.60437 35311.25780 20394.47270 9.77657 29438.52150 20606.06640 9.84160 42509.96090 20488.37500 10.09644 24946.23630 19272.28520 10.26473 24402.79490 19494.67380 10.42091 38604.35940 20171.22270 10.55440 22594.34180 20487.28520 10.76932 39757.06250 20055.43360 10.91930 46911.87110 20154.14650 11.16057 33845.78910 20396.83400 11.97332 29695.01560 19972.38870 12.16527 41121.92190 20340.83790 Try also with TREOR and McMaille. Go back to previous exercises and try the programs that were not already applied. Paly with Chekcell. Tip-24 : A simple way to deal with large cells without changing the default values of the indexing program is to give a fictitious wavelength being 2, 5 or 10 times (proteins) smaller than the real one. Then, the obtained cell parameters will be 2, 5 or 10 times smaller that the effective ones. Additional notes Not obtaining results with TREOR, DICVOL04 or McMaille, you may consider trying with CRYSFIRE (see session 3 of the SDPD Internet Course, or the CCP14 Web site). Consider also to use N-TREOR (either standalone or inside of EXPO2004) instead of TREOR. Visit the Indexing Benchmarks Web pages comparing the performances of many indexing programs, and see why using ITO may not be very interesting. References Useful Web address : CCP14 : http://www.ccp14.ac.uk/ Indexing Benchmarks : http://sdpd.univ-lemans.fr/uppw/benchmarks/ SDPD Internet Course : http://sdpd.univ-lemans.fr/DU-SDPD/ Most recent review papers about indexing : P.-E. Werner in “Structure Determination from Powder Diffraction Data”, Edited by W.I.F David, K. Shankland, L.B. McCusker and Ch. Baerlocher, Oxford Science Publications, Chapter 7 : “Autoindexing”, 2002, 118-135. R. Shirley, “Overview of powder-indexing program algorithms (history and strenghts and weaknesses). IUCr Computing Commission Newsletter 2 (2003) 48-54. J. Bergmann, A. Le Bail, R. Shirley and V. Zlokazov, “Renewed interest in powder diffraction data indexing”, Z. Kristallogr. 219 (2004) 783-790. Programs : Chekcell : J. Laugier & B. Bochu, http://www.inpg.fr/LMGP (and CCP14) CRYSFIRE : R. Shirley, “The Crysfire 2002 system for automatic powder indexing: user’s manual. Lattice Press: Guilford, UK (2002). DICVOL04: A. Boultif & D. Louër, “Powder pattern indexing with the dichotomy method”, J. Appl. Crystallogr. 37 (2004) 724-732. McMaille : A. Le Bail, “Monte Carlo indexing with McMaille”, Powder Diffraction 19, 2004, 249-254. http://www.cristal.org/McMaille/ N-TREOR : A. Altomare, C. Giacovazzo, A. Guagliardi, A.G.G. Moliterni, R. Rizzi & P.-E. Werner,“New techniques for indexing : N-TREOR in EXPO”, J. Appl. Crystallogr. 33 (2000) 1180-1186. PowderX : C. Dong, “PowderX: Windows-95-based program for powder X-ray diffraction data processing”, J. Appl. Crystallogr. 32 (1999) 838. TREOR: P.-E. Werner, L. Eriksson & M. Westdahl, “TREOR, a semi-exhaustive trial-anderror powder indexing program for all symmetries”, J. Appl. Cryst. 18 (1985) 367-370. WinPLOTR : T. Roisnel & J. Rodriguez-Carvajal, http://www-llb.cea.fr/fullweb/winplotr/winplotr.htm

