CSS 590 Field Plot Technique
advertisement
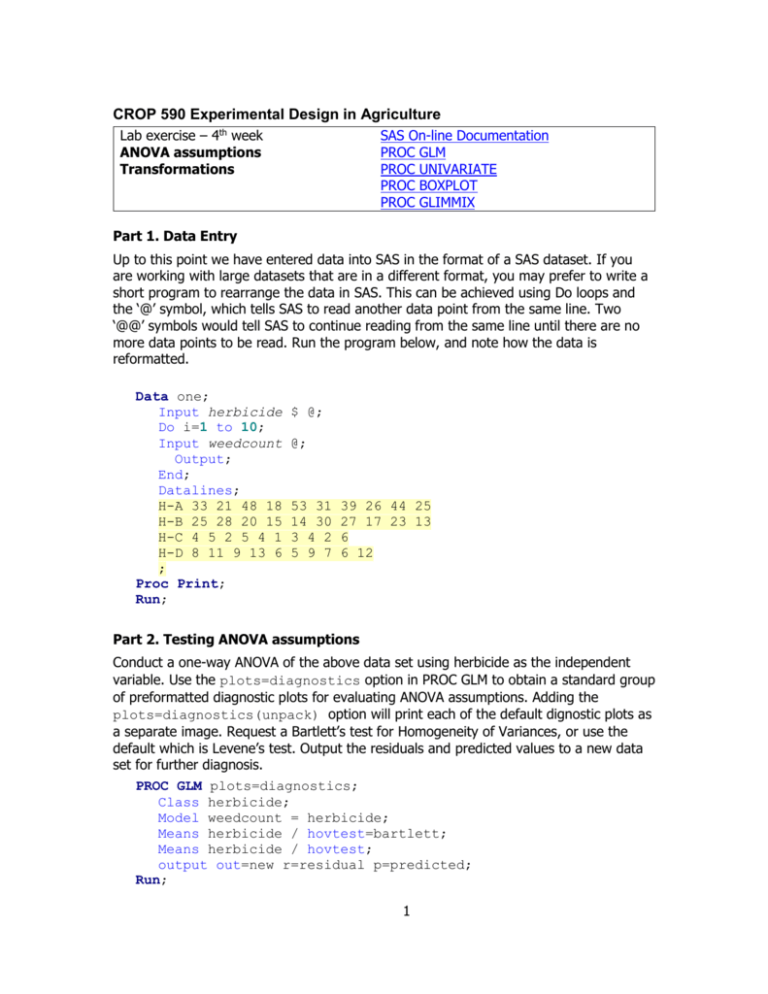
CROP 590 Experimental Design in Agriculture Lab exercise – 4th week ANOVA assumptions Transformations SAS On-line Documentation PROC GLM PROC UNIVARIATE PROC BOXPLOT PROC GLIMMIX Part 1. Data Entry Up to this point we have entered data into SAS in the format of a SAS dataset. If you are working with large datasets that are in a different format, you may prefer to write a short program to rearrange the data in SAS. This can be achieved using Do loops and the ‘@’ symbol, which tells SAS to read another data point from the same line. Two ‘@@’ symbols would tell SAS to continue reading from the same line until there are no more data points to be read. Run the program below, and note how the data is reformatted. Data one; Input herbicide Do i=1 to 10; Input weedcount Output; End; Datalines; H-A 33 21 48 18 H-B 25 28 20 15 H-C 4 5 2 5 4 1 H-D 8 11 9 13 6 ; Proc Print; Run; $ @; @; 53 31 14 30 3 4 2 5 9 7 39 26 44 25 27 17 23 13 6 6 12 Part 2. Testing ANOVA assumptions Conduct a one-way ANOVA of the above data set using herbicide as the independent variable. Use the plots=diagnostics option in PROC GLM to obtain a standard group of preformatted diagnostic plots for evaluating ANOVA assumptions. Adding the plots=diagnostics(unpack) option will print each of the default dignostic plots as a separate image. Request a Bartlett’s test for Homogeneity of Variances, or use the default which is Levene’s test. Output the residuals and predicted values to a new data set for further diagnosis. PROC GLM plots=diagnostics; Class herbicide; Model weedcount = herbicide; Means herbicide / hovtest=bartlett; Means herbicide / hovtest; output out=new r=residual p=predicted; Run; 1 Manually obtain residual plots, using the herbicide names as labels and the vref=0 option to include a reference line at eij = 0: PROC GPLOT data=new; plot residual*predicted = herbicide / vref=0; run; You can obtain box plots similar to the ones that SAS creates when you run PROC GLM by using the BOXPLOT procedure. PROC BOXPLOT data=new; Plot residual*herbicide; Run; Proc Univariate can be used to test for normality (normal statement) and to obtain a variety of descriptive plots, including normal probability plots (plots statement). proc univariate data=new normal plots; histogram residual/kernel; QQPLOT residual /NORMAL(MU=EST SIGMA=EST L=1); var residual; run; Part 3. Data Transformation Are the residuals for the variable ‘weedcounts’ normally distributed? Do they have homogeneous variance? What is your proof? If not, can you determine what transformation is needed? Rerun your analysis on the transformed data and recheck the ANOVA assumptions. Tests for homogeneity of variance in SAS can only be run on one-way models. According to the SAS help information, "homogeneity of variance testing for more complex models is a subject of current research." Two approaches can be found in the literature for testing for HOV in a Randomized Block Design. One is to simply ignore blocks and check for HOV of treatment groups. Another is to adjust the data for blocks (remove the block effects) and then run hovtests using a one-way model for the treatment groups. If no suitable transformation can be identified, data with heterogeneous variance can still be analyzed with PROC MIXED, using a Repeated statement with an unstructured covariance option (Type=un). We will discuss this topic more in the lab exercise on repeated measures. Part 4. Generalized Linear Models Generalized Linear Models are becoming the method of choice for analyzing data that are not normally distributed, but follow another probability distribution in the exponential family (which includes normal, binomial, Poisson, gamma, and negative binomial distributions.) Appropriate use of Generalized Linear Models requires an understanding of the underlying theory, which is beyond the scope of this class. To get some idea about the SAS syntax and output for this type of analysis, run the following program: 2 proc glimmix data=one; Class herbicide; Model weedcount = herbicide / link=log s dist=poisson; lsmeans herbicide/ilink diff CL; run; How do the F tests and estimates of the means compare to the analysis of transformed data? Later in the term, we will conduct combined analyses across multiple experiments and learn how to determine if the variances for those experiments are homogeneous. PROC MIXED and PROC GLIMMIX can both be used to account for heterogeneous variances without the use of transformations. Part 5. Detection of Outliers In general, obvious outliers can be identified visually from residual plots. If you are confident that a mistake or abnormality occurred during data collection, it may be best to treat that observation as a missing plot. On the other hand, unusual variation that is real may provide valuable insights and should not be ignored or discarded. We should also avoid the temptation to massage our data to make it meet our expectations. If you are not sure how to handle an outlier, you may want to “studentize” the residuals to express them in standardized units. This may help in establishing an objective criterion for outlier detection. For example, you might decide that values of studentized residuals that are greater than 4 standard errors from a mean of zero are too extreme and were likely the result of a mistake during data collection. Replace one of the data points in the original data set with an outlier and rerun the analysis. Various options can be used in PROC GLM to obtain diagnostic statistics for outlier detection. Proc GLM data=three plots=diagnostics; Class herbicide; Model weedcount = herbicide; Means herbicide / hovtest=bartlett; Means herbicide / hovtest; output out=new r=residual p=predicted student=studres stdr=rstderr cookd=cookct covratio=covrat dffits=dffit; Run; Proc print; proc gplot data=new; plot residual*predicted = herbicide; plot studres*predicted = herbicide; Run; Note that the shapes of the two residual plots are the same, but values of studres are expressed in standard units. PROC MIXED also has some nice features for analyzing the influence of data outliers. proc mixed data=three; Class herbicide; Model weedcount = herbicide / influence; run; 3

