Homework 17
advertisement
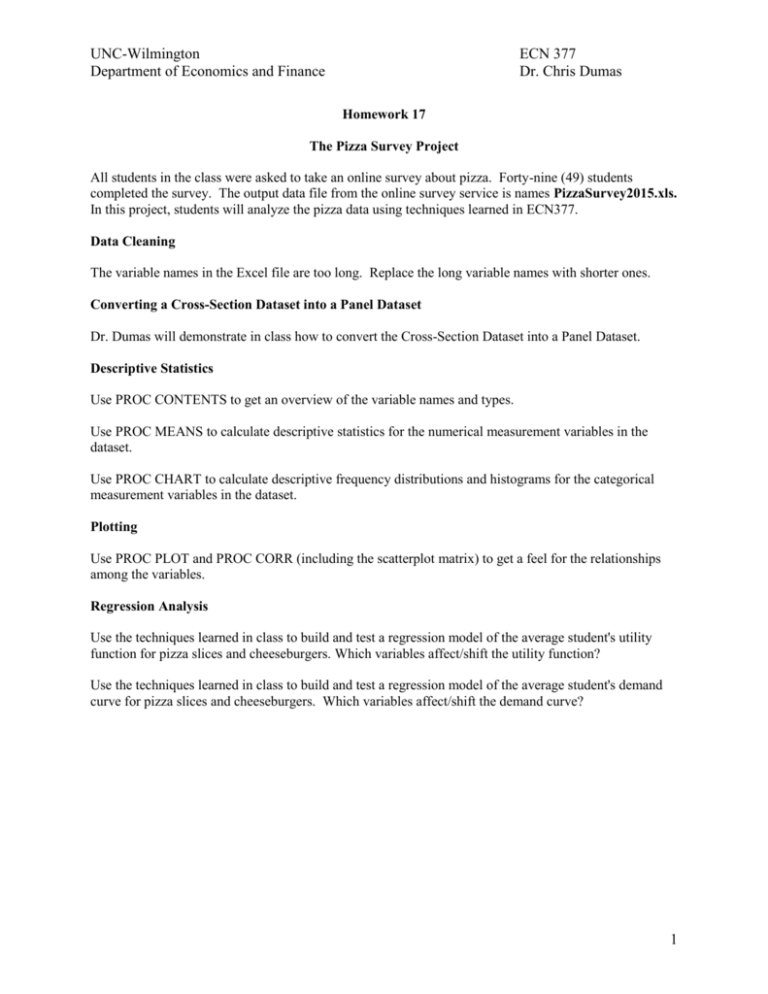
UNC-Wilmington Department of Economics and Finance ECN 377 Dr. Chris Dumas Homework 17 The Pizza Survey Project All students in the class were asked to take an online survey about pizza. Forty-nine (49) students completed the survey. The output data file from the online survey service is names PizzaSurvey2015.xls. In this project, students will analyze the pizza data using techniques learned in ECN377. Data Cleaning The variable names in the Excel file are too long. Replace the long variable names with shorter ones. Converting a Cross-Section Dataset into a Panel Dataset Dr. Dumas will demonstrate in class how to convert the Cross-Section Dataset into a Panel Dataset. Descriptive Statistics Use PROC CONTENTS to get an overview of the variable names and types. Use PROC MEANS to calculate descriptive statistics for the numerical measurement variables in the dataset. Use PROC CHART to calculate descriptive frequency distributions and histograms for the categorical measurement variables in the dataset. Plotting Use PROC PLOT and PROC CORR (including the scatterplot matrix) to get a feel for the relationships among the variables. Regression Analysis Use the techniques learned in class to build and test a regression model of the average student's utility function for pizza slices and cheeseburgers. Which variables affect/shift the utility function? Use the techniques learned in class to build and test a regression model of the average student's demand curve for pizza slices and cheeseburgers. Which variables affect/shift the demand curve? 1

