itm 361 final - Operations-Mng-C

Dominant factors in Manufacturing;
(1) Favorable labor climates
(2) Proximity to markets
(3) Quality of life
(4) Proximity to resources and suppliers
(5) proximity to the parent company’s facility
(6) utilities, taxes, and real estate costs
Dominant forces in services;
(1) proximity to customers
(2) transportation costs and proximity to markets
(3) location of competitors
(4) site-specific factors
Critical mass; situation where several competing firms clustered in one location attract more customers than the total number who would shop at the same stores in scattered locations
Geographical information system; system of computer software, hardware, and data that the firm’s personnel can use to manipulate, analyze, and present information relevant to a location decision
Advantages of expanding versus building new facility; keeping people together, reducing construction costs and time, and avoiding splitting up operations
Advantage building new plant; firm does not have to rely on the production from a single plant, hire new employees, new equipment, better technology
Load distance method; mathematical model used to evaluate locations based on proximity factors
-quantitative (objective)
Transportation method; quantitative approach that can help solve multiple facility location problems
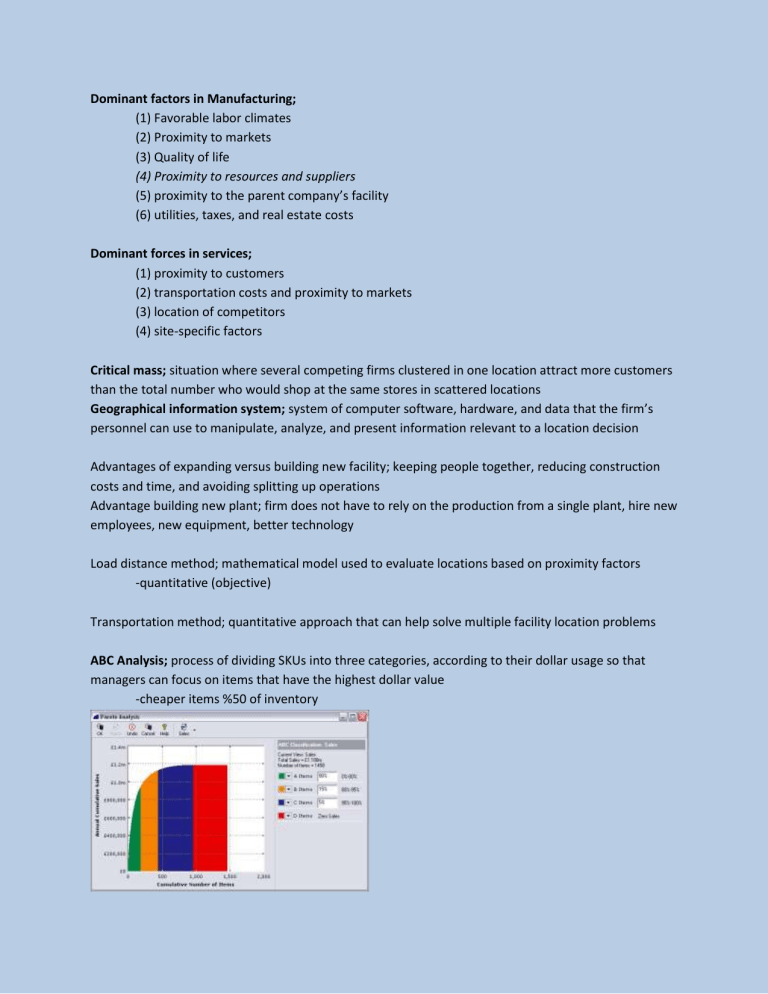
ABC Analysis; process of dividing SKUs into three categories, according to their dollar usage so that managers can focus on items that have the highest dollar value
-cheaper items %50 of inventory
Lot sizing; the quantity of an inventory item management either buys from a supplier or manufactures using internal processes
Tracking inventory method
(1) RFID
(2) assign someone responsibility to count (cycle counting)
(3) securing it behind locked doors (highly sensitive merchandise or legal merchandise)
(4) cycle inventory
(5) math errors, logic errors; checking errors
Economic order of quantity (EOQ); lot size that minimizes total annual inventory holding and ordering costs
-demand rate is constant and known for certain
-no constraints are placed on size of each lot
-only two relevant costs are inventory holding costs and fixed cost per lot
-decisions for one item can be made independently of decision for other items (no advantage in combining several orders to the same supplier)
-lead time is constant
Demand and holding costs have a linear relationship of 1 to 1
-independent demand items; items for which demand is influenced by market conditions and is not related to the inventory decisions for any other item held in stock
Time between orders (TBO); average time elapsed between receiving replenishment orders of Q units for a particular lot size
Difference between Q and P
-q-system is a fixed quantity order every P time (demand is uncertain)
-the order goes to level T at reorder point R
Q- continuous review system; system designed to track the remaining inventory of a SKU each time a withdrawal is made to determine whether it is time to order p-periodic review system; system which an item’s inventory position is reviewed periodically rather than constantly
Comparative advantages of the Q and P systems;
-neither is best for all situations
- advantages of one is disadvantage of other
P System Advantages
System is convenient because replenishments are made at fixed intervals
-fixed replenishment interval allows for standardized pickup and delivery times
Orders for multiple items from the same supplier can be combined into a single purchase order
-reduces ordering and transportation costs
Inventory position (IP) needs to be known only when a review is made
Q System Advantages
Review frequency of each SKU may be individualized
-can reduce total ordering and handling costs
Fixed lot sizes, if large enough, can result in quantity discounts
Lower safety stock results in savings
Inventory position = on-hand inventory – scheduled receipts – backorders
Visual system; system that allows employees to place orders when inventory visibly reaches a certain maker
Two-bin system; visual system version of Q-system in which a SKUs inventory is stored in two different locations
Total Q system costs= (annual) cycle inventory holding cost + ordering cost + safety stock holding cost
Forecast us a prediction of future events used for planning purposes
-planning is the process of making management decisions on how to deploy resources to best respond to demand forecasts
-forecasting methods; (1) judgment, (2) casual, (3) time series method
Demand patterns;
-time series; the repeated observation of demand for a service or product in their order of occurrence
-5 basic patterns of most demand time series;
(1) horizontal; fluctuation of data around a constant mean
(2) trend; systematic increase/decrease in the mean of the series over time
(3) seasonal; repeatable pattern of increases/decreases in demand, depending on the time of day, week, month, season
(4) cyclical; less predictable gradual increase/decrease in demand over longer periods of time (years or decades)
(5) random; unforecastable variation in demand
-cyclical patterns arise from two influences; (1) business cycle (economy in recession) (2) service/product life cycle
Forecasting judgment methods; translate the opinions of managers, expert opinions, consumer surveys and salesforce estimates into quantitative estimates
(1) salesforce estimates; forecasts complied from estimates made periodically by members of a company’s salesforce
quantities
-most likely to know which products customers will be buying in new future and what
(2) executive opinion; opinions, experience, and technical knowledge of one or more managers/customers are summarized to arrive at a single forecast
-used for technological forecasting
(3) market research; systematic approach to determine external consumer interest in a service/product by creating and testing hypothesis through data-gathering surveys
-designing questionnaires, how to administer it, get a sample, and analyze info
(4) Delphi; process of gaining consensus from a group of experts while maintain their anonymity
-useful when no historical data are available
-dependent variable; one the manager wants to forecast
-independent variables; assumed to affect the dv and “cause” the results observed in the past
Linear regression; one variable, dv, is related to one more iv by a linear equation
Sample coefficient r measures the direction and strength of the relationship between the iv and dv
Sample coefficient of determination measures the amount of variation in the dv about its mean that is explained by the regression line (0.0-1.0)
Standard error of the estimate; measures how closely the data on the dv cluster around the regression line… measures the error from the dv to the regression line rather than the mean
Time series methods (quantitative methods); uses historical information regarding only the dv
-assumes dv past will continue in the future
-naïve forecast; forecast for the next period equals the demand for the current period
-estimating the average; has no trend, seasonal, cyclical patterns
-the horizontal pattern in a time series is based on the mean of the demands so estimate the average of time series data
(1) simple moving average method; calculating the average demand for the n most recent time periods and using it as the forecast for future periods
(2) weighted moving average; uses as many periods of past demand as desired, each historical demand in the average can have its on weight, the sum of the weight equals 1
(3) exponential smoothing method; sophisticated weighted moving average that calculates the average of a time series by giving recent demands more weight than earlier demands
-most frequently used formal forecasting
Forecasting errors; difference found by subtracting the forecast from actual demand for a given period
-biased errors or random erros
(1) cumulative sum of forecasts errors; measures the total forecast error
(2) mean squared error, std and mean absolution deviation
Six Steps of forecasting process
Adjust History File
Prepare initial
Forecasts
Consensus meetings and collaboration
Finalize and
Communicate
Reviewing by
Operating
Committee
Revise forecasts
Forecast slides 13-61
Definition slide 13-10; show cpfr process .. 9 step process for supply chain integration that allows a supplier and its customers to collaborate on making the forecast by using the internet


