R script for filtering markers in genotypic disequilibrium
advertisement
R script for filtering markers in genotypic disequilibrium
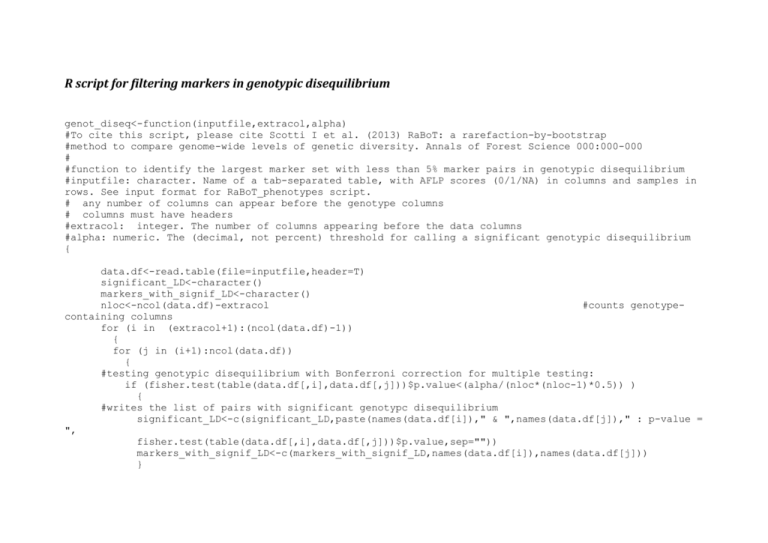
genot_diseq<-function(inputfile,extracol,alpha)
#To cite this script, please cite Scotti I et al. (2013) RaBoT: a rarefaction-by-bootstrap
#method to compare genome-wide levels of genetic diversity. Annals of Forest Science 000:000-000
#
#function to identify the largest marker set with less than 5% marker pairs in genotypic disequilibrium
#inputfile: character. Name of a tab-separated table, with AFLP scores (0/1/NA) in columns and samples in
rows. See input format for RaBoT_phenotypes script.
# any number of columns can appear before the genotype columns
# columns must have headers
#extracol: integer. The number of columns appearing before the data columns
#alpha: numeric. The (decimal, not percent) threshold for calling a significant genotypic disequilibrium
{
data.df<-read.table(file=inputfile,header=T)
significant_LD<-character()
markers_with_signif_LD<-character()
nloc<-ncol(data.df)-extracol
#counts genotypecontaining columns
for (i in (extracol+1):(ncol(data.df)-1))
{
for (j in (i+1):ncol(data.df))
{
#testing genotypic disequilibrium with Bonferroni correction for multiple testing:
if (fisher.test(table(data.df[,i],data.df[,j]))$p.value<(alpha/(nloc*(nloc-1)*0.5)) )
{
#writes the list of pairs with significant genotypc disequilibrium
significant_LD<-c(significant_LD,paste(names(data.df[i])," & ",names(data.df[j])," : p-value =
",
fisher.test(table(data.df[,i],data.df[,j]))$p.value,sep=""))
markers_with_signif_LD<-c(markers_with_signif_LD,names(data.df[i]),names(data.df[j]))
}
}
}
#gets markers with genotypic diseq, by ascending order of number of pairs
lowLDlist<-names(sort(table(markers_with_signif_LD)))
#gets the list and number of loci NOT involved in genot. diseq.:
noLDlist<names(data.df)[which(is.element(names(data.df)[(extracol+1):ncol(data.df)],lowLDlist)==FALSE)+extracol]
noLDnum<-length(noLDlist)
#loop to decrease the number of markers, one by one until 100, and record percent genot.
diseq. pairs at each round:
list_percentLD<-numeric()
for (z in length(lowLDlist):1)
{
lowLDnums<-integer()
for (i in 1:z)
{
lowLDnums<-c(lowLDnums,which(names(data.df)==lowLDlist[i]))
}
#gets the numbers of the z columns containing the z less LD-ed markers:
lowLDnums<-sort(lowLDnums)
#getting a marker set with the lowLD z-marker set:
data_lowLD.df<-data.df[,c(1:extracol,lowLDnums)]
#re-analysing LD:
significant_LD<-0
for (i in (extracol+1):(extracol+z-1))
{
for (j in (i+1):(extracol+z))
{
if
(fisher.test(table(data_lowLD.df[,i],data_lowLD.df[,j]))$p.value<(0.05/((z+noLDnum)*((z+noLDnum)-1)/2)))
{
significant_LD<-significant_LD+1
}
}
}
percentLD<-100*significant_LD/((z+noLDnum)*((z+noLDnum)-1)/2)
list_percentLD<-c(list_percentLD,percentLD)
maxloc<-z
if (percentLD<5) break
}
list_percentLD.mt<-cbind(seq(length(lowLDlist)+noLDnum,z+noLDnum,-1),list_percentLD)
plot(list_percentLD.mt,pch=21,bg="grey",cex=0.75,xlab="Number of markers",ylab="Significant pairs
(%)",main="Pairs of markers\nin linkage disequilibrium")
#right number: maxloc
#re-obtaining data sets:
#getting column numbers:
lowLDnums<-integer()
for (i in 1:maxloc)
{
lowLDnums<-c(lowLDnums,which(names(data.df)==lowLDlist[i]))
}
lowLDnums<-sort(lowLDnums)
noandlowLDnums<sort(c(lowLDnums,(which(is.element(names(data.df)[(extracol+1):ncol(data.df)],lowLDlist)==FALSE)+extracol)
))
data_lowLD.df<-data.df[,c(1:extracol,noandlowLDnums)]
#exporting:
write.table(file=paste(length(noandlowLDnums),"mark_lowdiseq_",inputfile,sep=""),data_lowLD.df,
row.names=FALSE,sep="\t",quote=FALSE)
}
