IGCSE Biology Lab Report Rubric
advertisement

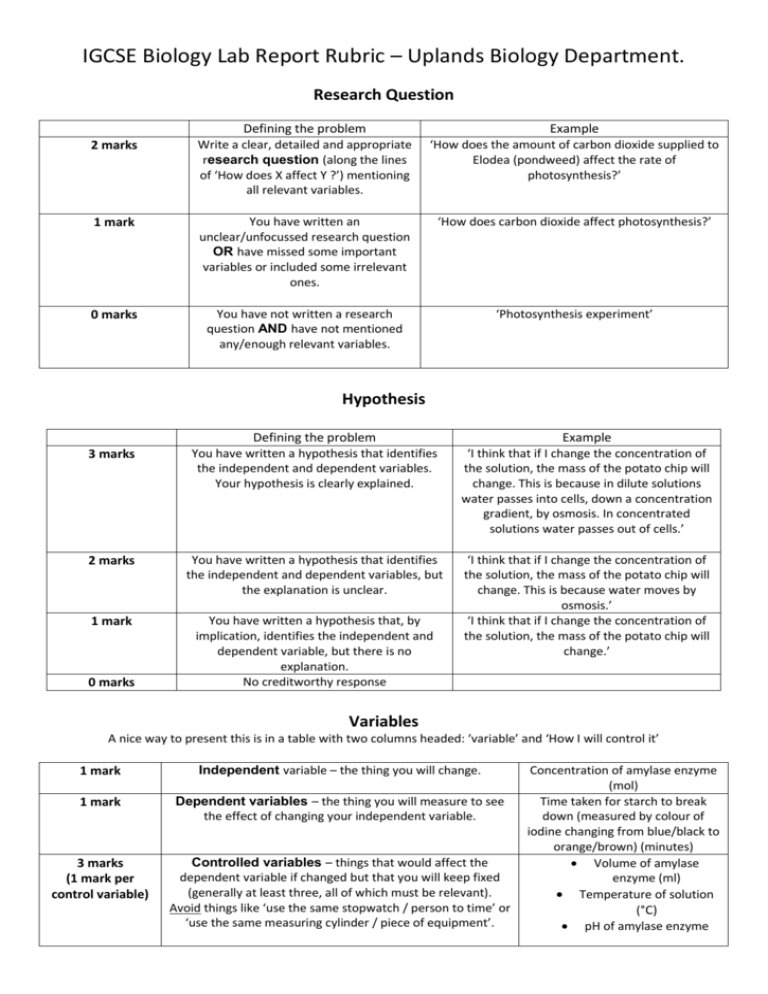
IGCSE Biology Lab Report Rubric – Uplands Biology Department. Research Question Defining the problem Write a clear, detailed and appropriate research question (along the lines of ‘How does X affect Y ?’) mentioning all relevant variables. Example ‘How does the amount of carbon dioxide supplied to Elodea (pondweed) affect the rate of photosynthesis?’ 1 mark You have written an unclear/unfocussed research question OR have missed some important variables or included some irrelevant ones. ‘How does carbon dioxide affect photosynthesis?’ 0 marks You have not written a research question AND have not mentioned any/enough relevant variables. ‘Photosynthesis experiment’ 2 marks Hypothesis Defining the problem You have written a hypothesis that identifies the independent and dependent variables. Your hypothesis is clearly explained. Example ‘I think that if I change the concentration of the solution, the mass of the potato chip will change. This is because in dilute solutions water passes into cells, down a concentration gradient, by osmosis. In concentrated solutions water passes out of cells.’ 2 marks You have written a hypothesis that identifies the independent and dependent variables, but the explanation is unclear. 1 mark You have written a hypothesis that, by implication, identifies the independent and dependent variable, but there is no explanation. No creditworthy response ‘I think that if I change the concentration of the solution, the mass of the potato chip will change. This is because water moves by osmosis.’ ‘I think that if I change the concentration of the solution, the mass of the potato chip will change.’ 3 marks 0 marks Variables A nice way to present this is in a table with two columns headed: ‘variable’ and ‘How I will control it’ 1 mark Independent variable – the thing you will change. 1 mark Dependent variables – the thing you will measure to see the effect of changing your independent variable. 3 marks (1 mark per control variable) Controlled variables – things that would affect the dependent variable if changed but that you will keep fixed (generally at least three, all of which must be relevant). Avoid things like ‘use the same stopwatch / person to time’ or ‘use the same measuring cylinder / piece of equipment’. Concentration of amylase enzyme (mol) Time taken for starch to break down (measured by colour of iodine changing from blue/black to orange/brown) (minutes) Volume of amylase enzyme (ml) Temperature of solution (°C) pH of amylase enzyme Apparatus Should include a bulleted list of apparatus, materials and a labelled diagram of the experimental setup (only needed if you have a complicated setup) 2 marks Detailed list of all equipment used, specifying numbers, sizes, volumes, concentrations, chemical names, etc. 50cm3 glass beaker, 1 DP mass balance, pH probe, 200cm3 of 2M HCl 1 mark All equipment is included but it lacks detail. Small beakers, large measuring cylinders, timers, acid. 0 marks Not all relevant materials are included or some are irrelevant to the investigation. Beaker, balance, pencil, paper, eraser. Method Should be written as a step by step set of instructions – numbered or bullet pointed. Your risk assessment should be laid out in the format of a table. Try and include at least 3 risks. Hazard Method of control e.g. Water bath at 90 °C could cause burns to skin e.g. Use tongs to remove hot objects from the bath. Results Table You should include your tables of data collected during the experiment both quantitative (numbers) and qualitative (written). Your processed data would also be included in this section. 2 marks 1 mark You have recorded all appropriate quantitative (numbers) and qualitative (written) data in a table. You must: Write units in the column headings not the body of the table. They are best written in brackets. Write the actual value of your independent variables, not the one you intended, for example you may have planned to use a concentration of 1.0M but actually used 1.15M. Be consistent with the accuracy of your recordings (generally to 2 d.p.) Your table must be clearly laid out with appropriate headings and a title One example for each type of calculation Units in the headings are missing or recordings have inconsistent d.p. Qualitative observations not recorded. Units in the table body. Unclear headings. Incorrect units given. Surface area of cube (cm2) Trial 1 0 marks Trial 2 Trial 3 Mean 2 4 6 8 10 Surface area of cube (cm2) 2 4 6 8 10 Data not collected in a table format. Not enough data collected, or data collected is irrelevant. Processed data missing. Your table is too difficult to read. Data table Time taken for complete colour change (s) Data table Time taken Observation (qualitative) Graph Draw a graph (normally a line graph with a line of best fit or a bar chart). 3 marks 1 mark for each bullet point Correct X (independent variable) and Y (dependent variable) axes labelled. Points plotted correctly (with line of best fit if necessary) Correct units on axes Mass of Calcium Carbonate lost vs Reaction time Do not go beyond data points with your line of best fit. Do not join points with straight lines – use a line or curve of best fit. Conclusion This section is to do with reaching and explaining a conclusion that states the pattern you observed in your results and correctly applies your understanding of Biology to explain this pattern 3 marks 2 marks 1 mark 0 marks You must reach a justified conclusion. You should: Stated whether your conclusion supports your hypothesis. State a conclusion based on a correct interpretation of your results. State in detail the pattern your results give. For example a strong/weak, positive/negative correlation. Explain any trends in detail using correctly applied scientific knowledge. Where the pattern you saw is not what should have happened, try to identify reasons for this. Use and manipulate data. You have met most of the above criteria, but you have not referred to data or your explanation of results is lacking detail. You have stated a conclusion but have not justified with (correct) scientific knowledge. You have not referred to data. You have either not reached a conclusion or have not reached the correct conclusion based on the data you collected. The purpose of this lab was to determine if a sugar cube or small grains of sugar would dissolve faster in water. Before doing this experiment, it was predicted that the small grains would dissolve faster. The collected data shows that when the two types of sugars were stirred in the water, the grains dissolved much more quickly than the sugar cube. This occurred in all three trials. On average, the grains dissolved in 1.24 minutes and the cube took 1.58 minutes to dissolve. A factor that affects the rate of a reaction is the surface area. According to the collision theory, smaller surface area will increase the chance of successful collisions between the molecules of the reactants. Our results support the collision theory, as the grains dissolved faster because they had more surface area, which allowed more water molecules to surround the sugar and dissolve it. Small grains of sugar dissolve faster that the sugar cubes because they are smaller in size. My hypothesis was correct and my results support my conclusion. The experiment went well and I obtained reliable results. Evaluation This section indentifies the limitations of your experiment and makes concrete suggestions for improvement. Your evaluation needs to refer explicitly to the data you collected. A good way to present your evaluation is in a table with three columns labelled “error”, “limitations”, “improvements” 2 marks 1 mark 0 marks Comment on the quality of your results and the relevance of any anomalies. Identify the main sources of errors (at least 2) and what effects these would have had on your results, being specific and detailed. Suggest an improvement for each limitation you identified in the evaluation making specific detailed suggestions for improvements – using different (named) equipment or setting up the experiment differently or using an entirely different method. You have correctly identified some errors but have not evaluated their effect on your results. The weakness and limitations you identified are irrelevant. When weighing the potato chips after they had been submerged in water they may not have been dried correctly. This may have left excess water on the potatoes which will have affected their final mass. In order to minimize this error, the potato chips should each be dried for a minimum of 30 seconds to ensure all excess liquid is removed. The potato was still wet so this may have changed its final mass. My data is weak, so I suggest doing more repeats or take more time doing the experiment. Total marks = 30 Research question Hypothesis Variables Apparatus Method Results table Graph Conclusion Evaluation 2 3 5 2 8 2 3 3 2


