Cooling Plant Optimization
advertisement
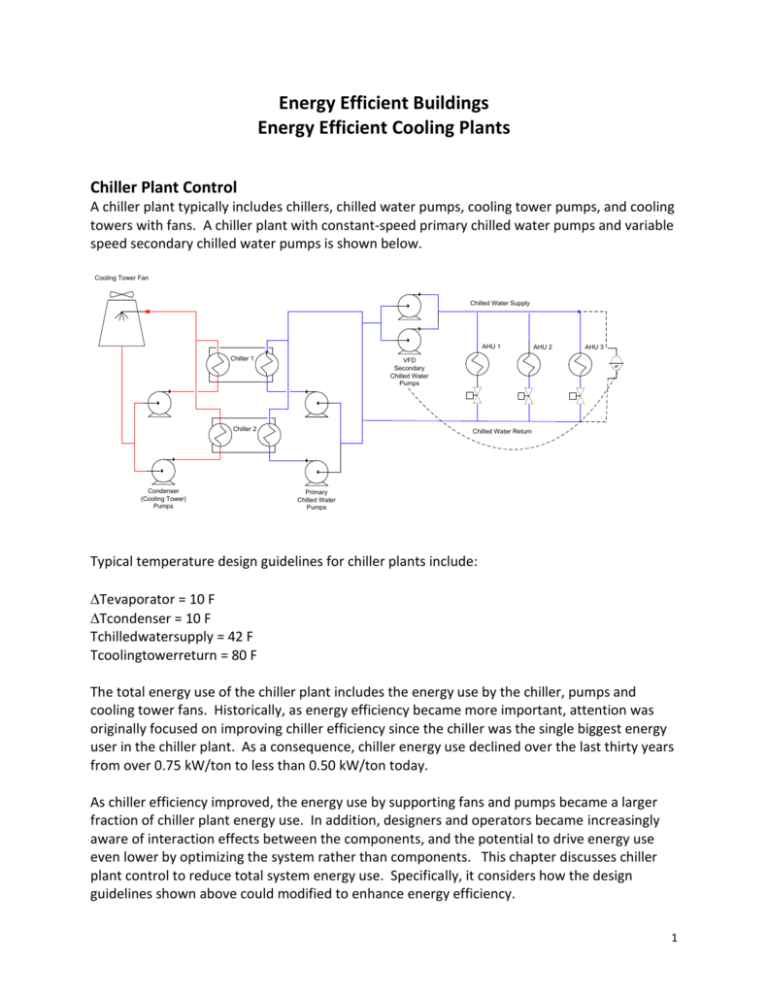
Energy Efficient Buildings Energy Efficient Cooling Plants Chiller Plant Control A chiller plant typically includes chillers, chilled water pumps, cooling tower pumps, and cooling towers with fans. A chiller plant with constant-speed primary chilled water pumps and variable speed secondary chilled water pumps is shown below. Cooling Tower Fan Chilled Water Supply AHU 1 Chiller 1 VFD Secondary Chilled Water Pumps Chiller 2 Condenser (Cooling Tower) Pumps AHU 2 AHU 3 dP Chilled Water Return Primary Chilled Water Pumps Typical temperature design guidelines for chiller plants include: Tevaporator = 10 F Tcondenser = 10 F Tchilledwatersupply = 42 F Tcoolingtowerreturn = 80 F The total energy use of the chiller plant includes the energy use by the chiller, pumps and cooling tower fans. Historically, as energy efficiency became more important, attention was originally focused on improving chiller efficiency since the chiller was the single biggest energy user in the chiller plant. As a consequence, chiller energy use declined over the last thirty years from over 0.75 kW/ton to less than 0.50 kW/ton today. As chiller efficiency improved, the energy use by supporting fans and pumps became a larger fraction of chiller plant energy use. In addition, designers and operators became increasingly aware of interaction effects between the components, and the potential to drive energy use even lower by optimizing the system rather than components. This chapter discusses chiller plant control to reduce total system energy use. Specifically, it considers how the design guidelines shown above could modified to enhance energy efficiency. 1 Source data: Trane, 2000, “Chilled Water System Design and Operation”, CTV-SLB005-EN. Reduce Cooling Tower Fan Energy Use Cooling tower fan energy use can be reduced by reducing the friction loss as air flows through the cooling tower and by reducing the flow rate of air. Friction losses are much smaller in induced flow-cooling towers than forced-flow cooling towers. In addition, improved packing designs increase evaporative contact area while reducing friction losses. Low-friction cooling towers can be identified by comparing rated fan motor power per rated cooling capacity. Cooling tower fan energy use can also be reduced by better air flow control. The temperature of the water leaving a cooling tower is typically controlled by varying the air flow rate through the cooling tower. In older cooling towers, air flow rate was varied by cycling the cooling tower fan on and off. A more energy efficient method of control is to vary the fan speed since friction pressure drop is lower at lower air flows; the fan affinity law of fluid work varying with the cube of flow applies to cooling towers as well duct systems. Two speed cooling tower fan motors approximate this type of control. Today, full variable speed control is achieved by controlling fan speed with a variable-frequency drive. The table and graph below show simulated cooling tower fan electricity use for a constantspeed on/off and variable-speed 10-hp fan motor running continually in Dayton, OH with a 10 F temperature drop and an 80 F condenser supply temperature. The constant-speed fan is on 47% of the year, while the variable speed fan runs at 37% of full speed. During hot, humid weather, the fraction energy savings from variable-speed cooling tower fan control are less 2 since the cooling tower fan must operate at close to full load. However, during cool, dry conditions, the fraction energy savings from variable-speed cooling tower fan control are significant. Overall, fan energy was reduced by about 64%. Month ====== 1 2 3 4 5 6 7 8 9 10 11 12 ====== Year CSfon VSffs Ecsf(kWh) Evsf(kWh) Esav(kWh) FracSav ====== ====== ====== ====== ====== ====== 0.26 0.17 1,467 69 1,398 0.95 0.27 0.18 1,368 71 1,297 0.95 0.33 0.23 1,862 153 1,709 0.92 0.38 0.26 2,061 223 1,838 0.89 0.49 0.36 2,745 572 2,173 0.79 0.69 0.58 3,740 1,794 1,945 0.52 0.87 0.8 4,856 3,658 1,198 0.25 0.8 0.71 4,473 2,860 1,614 0.36 0.63 0.51 3,405 1,510 1,895 0.56 0.39 0.27 2,151 226 1,925 0.89 0.33 0.22 1,793 147 1,646 0.92 0.29 0.19 1,621 99 1,523 0.94 ====== ====== ====== ====== ====== ====== 0.48 0.37 31,543 11,381 20,162 0.64 Reduce Cooling Tower Water Flow Rate After cooling tower fan energy use is addressed, energy savings from reducing cooling tower water flow rate can be explored. Cooling towers are typically designed to operate with a fixed flow rate of water. A typical flow rate for cooling towers is 3 gpm per rated ton of chiller capacity. However, reducing the water flow rate reduces pumping costs and improves cooling tower effectiveness. Moreover, if system is originally designed for less flow, smaller pipes and pumps can reduce first costs. Consider the following example. Example 3 A cooling tower is originally designed and operated with 5 gpm of water per ton with a 10 F temperature gain through the condenser. The required elevation head is 10 ft H20 and the friction head is 20 ft H2O. The pump is 70% efficient and the pump motor is 90% efficient. The water flow rate is then reduced to 3 gpm per ton. If the wet-bulb temperature of the air is 60 F, determine a) the water temperature leaving the cooling tower at 5 gpm, b) the water temperature leaving the cooling tower at 3 gpm, c) the pumping power at 5 gpm per ton, d) the pumping power at 3 gpm per ton, and e) the fraction reduction in pumping power. a) From the cooling tower performance chart for a tower operated at 5 gpm/ton, the temperature of water leaving a cooling tower is about 80 F when the temperature range is 10 F and the wet-bulb temperature of the air is 60 F. b) If the tower flow rate were reduced to 3 gpm/ton, the new temperature range can be found from an energy balance on the condenser. Qcond = V1 p cp Tcond1 = V2 p cp Tcond2 Tcond2 = (V1 / V2) Tcond1 = (5 gpm/ton / 3 gpm/ton) 10 F = 16.7 F From the cooling tower performance chart for a tower operated at 3 gpm/ton, the temperature of water leaving a cooling tower when the temperature range is 16.7 F and the wet-bulb temperature of the air is 60 F is about 78 F. Thus, the temperature of water leaving the cooling tower declines with the lower flow rate. As long as the temperature of water to the condenser is greater than the minimum temperature required by the chiller, reducing the temperature of water to the condenser improves the efficiency of the chiller. c) The initial pump head is: h1 = helev + hfric = 10 ft H2O + 20 ft H2O = 30 ft H2O The electrical power supplied to the pump motor at 5 gpm/ton is: P1 = V1 h1 / [ 3,960 (gpm-ftH20/hp) Epump Emotor ] P1 = 5 gpm/ton 30 ftH20 / [3,960 (gpm-ftH20/hp) 0.70 0.90] x 0.746 kW/hp P1 = 0.0449 kW/ton d) Reducing the flow rate to 3 gpm/ton reduces the pump work to overcome friction according to the pump affinity laws. The fluid work to overcome friction at 5 gpm/ton was: Wf1 = V1 hf1 / 3,960 (gpm-ftH20/hp) Wf1 = 5 gpm/ton 20 ftH20 / 3,960 (gpm-ftH20/hp) = 0.0253 hp/ton 4 According to the fan affinity law, the fluid work to overcome friction at 3 gpm/ton is: Wf2 = Wf1 (V2 / V1)3 = 0.0253 hp/ton (3 gpm/ton / 5 gpm/ton)3 = 0.00546 hp/ton The fluid work to overcome the elevation head is: We2 = V2 he / 3,960 (gpm-ftH20/hp) = 3 gpm/ton 10 ftH20 / 3,960 (gpm-ftH20/hp) = 0.00758 hp/ton Assuming the efficiencies of the pump and motor remain the same, the total electrical power to the pump motor at 3 gpm/ton is: P2 = (Wf2 + We2) / (Epump Emotor) P2 = (0.00546 hp/ton + 0.00758 hp/ton) / (0.70 x 0.90) x 0.746 kW/hp = 0.0154 kW/ton e) Thus, reducing the flow rate from 5 gpm/ton to 3 gpm/ton reduced the electrical power to the pump motor by (0.0449 kW/ton - 0.0154 kW/ton) / 0.0449 kW/ton = 66% The result in the example above indicates the savings potential from reducing the flow rate of condenser water through the cooling tower. In practice, this can sometimes be achieved by measuring temperature difference of water across the condenser, and reducing flow if the temperature difference is consistently small. Condenser Water Temperature Control Chiller efficiency improves with lower condenser water temperature. However, cooling tower fan energy use increases to deliver lower condenser water temperature. This suggests an optimum condenser water temperature may exist which would minimize total cooling tower fan plus chiller energy use. The affect of condenser water temperature on total cooling tower fan plus chiller electricity use can be modeled by solving a system of equations that includes cooling tower and chiller performance. Input values must be known for: Qevap (tons) = actually cooling load Qcap (tons) = cooling capacity of chiller Twb (F) = ambient wet-bulb temperture Tcsp (F) = set point temperature of cold water leaving cooling tower DWF (gpm/ton) = design water flow rate to cooling tower 5 To solve the system using successive substitution, start by assuming a temperature range Tr, across the cooling tower and then solving the following set of equations. The chiller fraction loaded, FL, is: 1) FL = Qevap / Qcap The minimum water temperature delivered by the cooling tower, Tc, is given by: 2) Tc = a + b Twb + c Tr + d Twb2 + e Tr2 + f Tr Twb However, cooling tower fans cycle on and off to maintain the water leaving the cooling tower at a set temperature Tcsp. Thus, to incorporate cooling tower control, Equation 2 must be followed by the following algorithm. From an energy balance, the fraction of time the cooling tower fan runs, Fon, and the actual entering and leaving cooling tower water temperatures Th and Tc are: 3) If Tc >= Tcsp then ‘fan runs continuously Fon = 1 Tc = Tc Th = Tc + Tr Else if Tc < Tcsp then ‘fan cycles on and off to maintain Tcsp Th = Tcsp + Tr Fon = (Tcsp – Th) / (Tc – Th) Tc = Tcsp End if Compressor input power per ton of evaporator cooling, KWPT, is given by: 4) KWPT = a + b FL + c FL2 + d Tc + e Tc2 + f Tc FL Then, from an energy balance on the chiller, compressor input power, Wcomp, heat rejected by the condenser, Qcond, volume flow rate of water through the condenser, Vw, and temperature rise across the condenser, Tr, are given by : 5) Wcomp = KWPT Qevap 6) Qcond = Wcomp + Qevap 7) Vw = DWF Qcap 8) Tr = Qcond / (Vw pw cpw) 6 where pw is the density of water and cpw is the specific heat of water. The value for Tr can then be substituted back into the start of the algorithm and the algorithm repeated until Tr converges. After convergence, cooling tower fan power, Wctf, can be calculated as: Wctf = Fon RHP FML / Emotor x 0.746 kW/hp Where RHP is cooling tower fan rated horsepower, FML is fraction motor loaded, Emotor is the efficiency of the motor. The total power of the cooling tower fan and compressor is: Wtot = Wctf + Wcomp Example Consider a 500-ton chiller operated at 300 tons with a 30-hp cooling tower fan and design water flow rate of 3 gpm/ton. The fan motor is 90% efficient. The outdoor air wet-bulb temperature is 60 F. Calculate total cooling tower fan plus compressor electrical power for cooling tower water set point temperatures of 80 F, 70 F and 60 F. Use of the algorithm shown above produces the following results. The minimum total cooling tower fan plus compressor electrical power (192 kW) occurred at a cooling tower water set point temperature of 70 F, which is 10 F greater than the outdoor air wet bulb temperature. This suggests that total cooling tower fan plus compressor electrical power might be minimized over an entire year by resetting the cooling tower water set point temperature according to outdoor air wet-bulb temperature. When this algorithm is incorporated into an hour-by-hour simulation program, the affect of condenser water temperature set point on total cooling tower fan plus chiller electricity use can be tested. For example, the following results shown below are for a 500-ton chiller operated at 7 300 tons with a 30-hp cooling tower fan and design water flow rate of 3 gpm/ton in Dayton, OH, and a cooling tower water set point temperature of 60 F. The results below show total cooling tower fan energy use for both a constant speed fan Ecsf and variable speed fan Evsf, compressor energy use, Ec, and total energy use for various cooling tower set-point temperatures. These results indicate that chiller plus cooling tower fan energy use can be reduced from a design condenser water temperature of 80 F by setting the cooling water temperature equal to the minimum condenser temperature recommended by the chiller manufacturer. Chiller plus cooling tower fan energy use can then be further reduced by varying cooling water temperature with outdoor air wet-bulb temperature. Tcsp (F) 80 70 60 50 Twb + 10 F Ecsf (kWh/yr) 52,296 93,217 134,651 173,341 1,498,886 Evsf (kWh/yr) 5,541 48,493 99,355 151,437 94,166 Ec (kWh/yr) 1,739,450 1,542,125 1,406,825 1,328,278 1,350,674 Ecsf + Ec (kWh/yr) 1,791,746 1,635,342 1,541,476 1,501,619 1,500,559 Evsf + Ec (kWh/yr) 1,744,991 1,590,618 1,506,180 1,479,715 1,444,840 8 These results are similar to an analysis by Trane, which showed that varying condenser water temperature with outdoor air wet-bulb temperature resulted in lower total energy costs than the design condenser water temperature or the minimum condenser water temperature that the chiller could accept. Source data: Trane, 2000, “Chilled Water System Design and Operation”, CTV-SLB005-EN. All Variable Flow Cooling Plants Traditionally, cooling plant pumps, fans and chillers were driven with constant speed motors. Load following capability was provided by bypass, mixing, staging and on/off control. Today, load following capability can be provided by varying the flow of the pumps, fans and chillers with variable frequency drives. Variable flow control can significantly reduce energy use over 9 traditional constant flow systems. The figure below shows an all variable-speed cooling plant. Variable-speed cooling plants have been documented to use as little as 0.5 kW/ton at high loads and 0.3 kW/ton at low loads (Erpelding, Ben, 2008, “Monitoring Chiller Plant Performance”, ASHRAE Journal, April, pp. 48-52.) Cooling Tower Fan VFD Chilled Water Supply AHU 1 AHU 2 AHU 3 Chiller 1 dP VFD VFD Chiller 2 VFD Condenser (Cooling Tower) Pumps Bypass Valve Flow Meter Chilled Water Return VFD Primary Chilled Water Pumps 10

