NSW_RateAssumptions_20150207_ElxPDR - Indico
advertisement
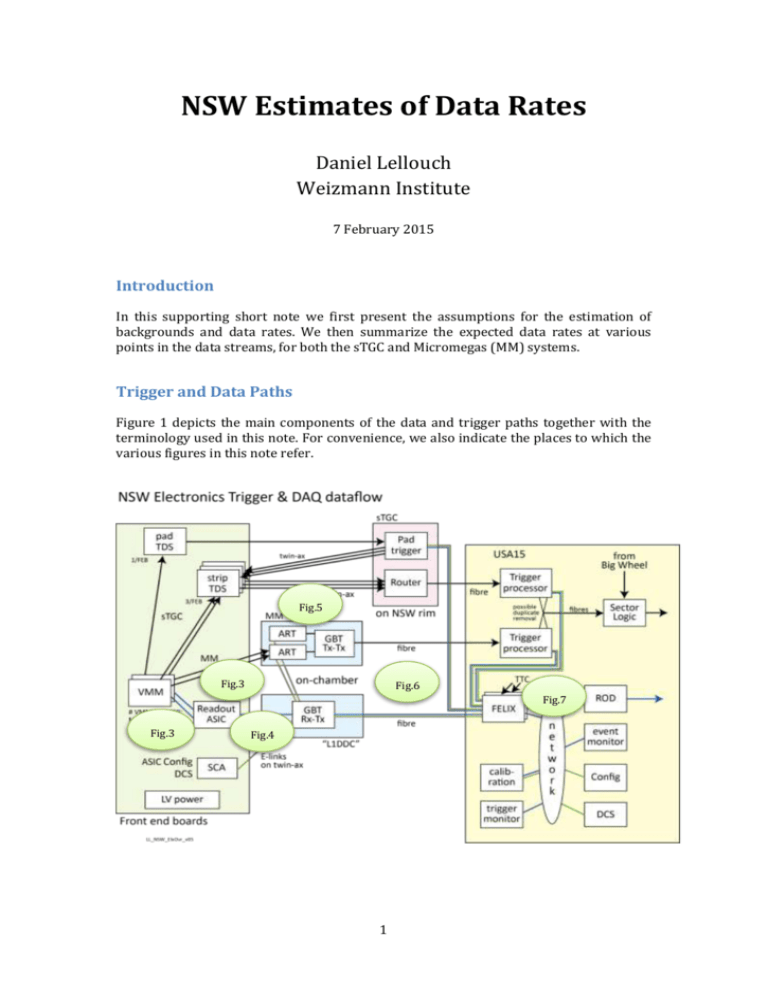
NSW Estimates of Data Rates Daniel Lellouch Weizmann Institute 7 February 2015 Introduction In this supporting short note we first present the assumptions for the estimation of backgrounds and data rates. We then summarize the expected data rates at various points in the data streams, for both the sTGC and Micromegas (MM) systems. Trigger and Data Paths Figure 1 depicts the main components of the data and trigger paths together with the terminology used in this note. For convenience, we also indicate the places to which the various figures in this note refer. Fig.5 Fig.3 Fig.6 Fig.7 Fig.3 Fig.4 1 Assumptions The data rates for the sTGC and Micromegas VMM chips to the Read Out (Sub) Controllers and thereon to the GBT and further the FELIX aggregators in USA15 have been evaluated under the following assumptions: 1. Accelerator Luminosity of 71034, backgrounds parameterized in MHz/(d&d) from RUN-1 measurements from MDT FI, and scaled according to luminosity1. A 1% neutron interaction probability is assumed for each active plane of both the sTGC and MM system. The effects of the increase in collision energy, the new beam pipe design and other shielding improvements for RUN-2 have been evaluated2. The overall correction is of the order of -30%. However, another increase due to a thinner NSW/JD shielding itself is to be expected. We assume that all these counterbalance. 2. The ratio between correlated and uncorrelated backgrounds is assumed to be the same as measured in RUN-1. 3. A particle gas-gap hit generates >~1 channel hit for pads and wires, 4.7 hits for strips in sTGC. For MM, a particle gas-gap hit generates hits in 10 strips (albeit over more than one bunch crossing); the fact that tracks originating from uncorrelated background might have a large incidence angle and produce many strip hits has been ignored. However, we believe this value of 10 to be a conservative estimate: preliminary simulations show that it varies between 4 and 9, depending on the angle and magnetic field. 4. For the sTGC system, realistic electronic noise has been considered, based on the measurements of the TGC system performed during RUN-1. 5. Level-0 trigger rate is 1 MHz, Level-1 trigger rate is 400 KHz. 6. Three bunch crossings are read out per Level-1 Accept for the sTGC system, and five for the MM. 7. Each readout controller drives up to four E-links to a GBT link, with input from all VMMs on a FEB (5,6,or7 for sTGC, 8 for MM).The information corresponding to one channel hit is represented by 40 bits in the VMM output format, 50 bits after 8b/10b encoding. 8. The ROC output format length is 32 bits per channel hit; the event header per Level-1 Accept produced by the ROC is 88 bits long. It is suppressed when no hits are present for an E-link for that Level-1 Accept. When output from FELIX, the header becomes 128 bits. 9. Data from Front end to FELIX is 8b/10b encoded, but FELIX decodes this before sending to the ROD. Results presented in this note are consolidated in the “sTGC parameter book”3. Backgrounds parametrization Figure 2 shows the parametrization of the uncorrelated, correlated and total backgrounds, in Hz/cm2, as a function of R. It should be noted that the active area starts at R=900 mm. The brown curve represents RUN-1 measurements scaled according to RUN-2 luminosity, while the green one shows the results of the parametrization. As 1 2 3 ATLAS new Small Wheel Technical Design Report, CERN-LHCC-2013-006, Fig 2.2 https://cds.cern.ch/record/1707800/files/ATL-COM-MUON-2014-027.pdf https://twiki.cern.ch/twiki/bin/view/Atlas/NSWParameterBook 2 Hz/cm2 expected, correlated background, which is more connected to direct physics sources, is relatively much more abundant at high η 20000 Run I scaled total background 18000 Parametrization of total background 16000 Parametrization of Correlated Parametrization of Uncorrelated 14000 12000 10000 8000 6000 4000 2000 0 500 1000 1500 2000 2500 3000 3500 4000 4500 Distance from Beam Line (mm) Fig. 2 : Parametrization of rates as a function of R Data rates from VMM chips Under the above assumptions, one can estimate the VMM output rate for both systems. Each calculation is performed twice, for the Small and Large sectors. One should note that strips in the MM system are ~8 times smaller than those in the sTGC system. As a result, for the same active area, the number of channels and therefore of VMM chips is 8 times larger. Figure 3 left shows the expected data rates for the sTGC system, in Mb/s. VMM chips are numbered from 1 (innermost) to 128 (outermost). The small discontinuity between VMMs 80 and 81 comes from the dead area at the border between the two MicroMegas modules. Figure 3 right is the equivalent sTGC system. VMM chips are named according to the quadruplet to which they belong, Q1 being the innermost one and Q3 the outermost. The “dip” in Q1, Q2, and Q3 “Strip 1” VMMs comes from the fact that they are not fully populated. As a conclusion, we can see that there is no bandwidth issue, since the link capacity is 640 Mb/s. 3 VMM # 126 121 116 111 106 101 96 91 86 81 76 71 66 61 56 51 46 41 36 31 26 21 16 11 6 1 Large sector Small Sector Mb/s 0 10 20 30 40 Q3 Strips 5 Q3 Strips 4 Q3 Strips 3 Q3 Strips 2 Q3 Strips 1 Q2 Strips 6 Q2 Strips 5 Q2 Strips 4 Q2 Strips 3 Q2 Strips 2 Q2 Strips 1 Q1 Strips 7 Q1 Strips 6 Q1 Strips 5 Q1 Strips 4 Q1 Strips 3 Q1 Strips 2 Q1 Strips 1 Q3 Wires Q2 Wires Q1 Wires Q3 Pads Q2 Pads Q1 Pads 2 Q1 Pads 1 Large Sector Small Sector Mb/s 0 50 100 150 200 Fig. 3: Data rates from the VMM chips for the MM (left) and sTGC (right) systems. E-links data rates The next point of concern is the bandwidth between the Readout ASIC (ROC) and the GBT. The ROC can be divided into sub controllers (SROC), providing multiple outputs to the GBT. The available bandwidth can be 80, 160 or 320 Mb/s, depending on the configuration, and within constraints of the GBT hardware. An estimate of the needed bandwidth is shown in Figure 4 for the sTGC system and Figure 5 for MicroMegas. Since we have freedom for VMM to SROC assignment, we’ve tried to balance as much as possible the E-link rates. The right part of the figure shows the configuration. 1 corresponds to a bandwidth of 80 Mb/s, 2 to 160 and 4 to 320. The worst case corresponds to the use of 47% of the available bandwidth. This assignment leaves space for contingency, assuming 320 Mb/s E-links. 4 250 Q3 SROC S2 Large Sector Small Sector Q3 SROC S1 Q3 SROC W Q3 SROC P Q2 SROC S2 Q2 SROC S1 Q2 SROC W Q2 SROC P Q1 SROC S4 Q1 SROC S3 Q1 SROC S2 Q1 SROC S1 Q1 SROC W Mb/s Q1 SROC P 0 50 100 150 0 2 4 2 4 Fig. 4: E-link data rates (in Mb/s) of the sTGC ROSC, and configuration settings (right) ROC 15 ROC 14 ROC 13 ROC 12 ROC 11 ROC 10 ROC 9 ROC 8 ROC 7 ROC 6 ROC 5 ROC 4 ROC 3 ROC 2 ROC 1 ROC 0 Large Sector Small Sector MB/s 0 50 100 150 200 250 300 0 Fig. 5: E-link data rates (in Mb/s) of the MM ROC, and configuration settings (right) 5 For the Micromegas ROC output E-links, as shown in Figure 5, there is not enough E-link capacity at the inner radii. Should the high rates be confirmed by a more realistic simulation in progress, as mentioned in assumption 3. above, more than one E-link can be used for the ROCs at the inner radii. GBT and Felix Rates The next rates we need to evaluate are those over the fibre between the GBT and FELIX, as well as the FELIX output. This is shown in Figures 6 and 7. For the former, the expected rates (<1Gb/s) are much below the bandwidth of 3.2 Gb/s. 1000 900 800 700 600 500 400 300 200 100 0 Small Sector Large Sector Gb/s Mb/s For the latter, a rate of 6 to 12 Gb/s is to be expected, since each FELIX device is connected to 16 GBTs (plus 2 trigger GBTs for the sTGC). 16 14 Small Sector 12 Large Sector 10 8 6 4 2 0 Fig. 6: Expected GBT output rates Fig 7: Expected FELIX output rates sTGC Pads Trigger Candidates in Sector The design of the trigger chain provides the capability of processing in parallel three trigger candidates originating from the sTGC pad logics. Because of the high rate of tracks from correlated background, one needs to check that the inefficiency due to background triggers remains tolerable. A crucial parameter of this calculation is the fraction of tracks from correlated background which will actually generate a pad trigger candidate. Early versions of the simulations have estimated this number to ~7%; however, this is not a safe estimate. We will therefore present results under the conservative assumption that no more than 30% of the tracks do actually produce a trigger. 6 Results are shown in Figure 8: under these assumptions, the probability that three background tracks are present in a sector remains under 310-3. This number can be intepreted as an upper limit to the trigger inefficiency due to background: if a real track is present, the probabilily of it being blinded by one of the three other background tracks is of the order of 310-3/4 = ~10-3. However, it should be pointed out that the latter number grows with the third power of the trigger rate, i.e. if the conservative assumption that 30% of the tracks do actually produce a trigger were change to 50%, the trigger inefficiency would be multiplied by a factor 4.6 . A more robust simulation remains to be done. 1 Small Sector Large sector 0.1 0.01 0.001 0.0001 Fig. 8: Fraction of bunch crossings with at least one trigger candidate in each group of quadruplets, and fractions of bunch crossings with at least 1, 2, or 3 candidates in the whole sector. 7
