Final_Write-Up_(Kush)-
advertisement

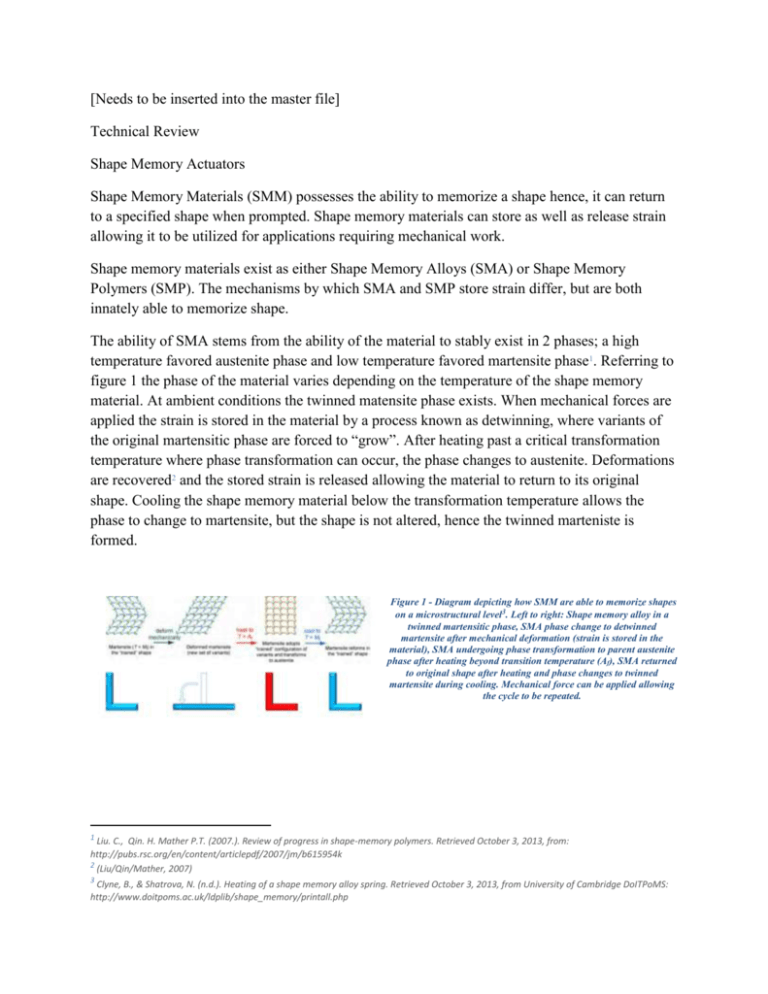
[Needs to be inserted into the master file] Technical Review Shape Memory Actuators Shape Memory Materials (SMM) possesses the ability to memorize a shape hence, it can return to a specified shape when prompted. Shape memory materials can store as well as release strain allowing it to be utilized for applications requiring mechanical work. Shape memory materials exist as either Shape Memory Alloys (SMA) or Shape Memory Polymers (SMP). The mechanisms by which SMA and SMP store strain differ, but are both innately able to memorize shape. The ability of SMA stems from the ability of the material to stably exist in 2 phases; a high temperature favored austenite phase and low temperature favored martensite phase1. Referring to figure 1 the phase of the material varies depending on the temperature of the shape memory material. At ambient conditions the twinned matensite phase exists. When mechanical forces are applied the strain is stored in the material by a process known as detwinning, where variants of the original martensitic phase are forced to “grow”. After heating past a critical transformation temperature where phase transformation can occur, the phase changes to austenite. Deformations are recovered2 and the stored strain is released allowing the material to return to its original shape. Cooling the shape memory material below the transformation temperature allows the phase to change to martensite, but the shape is not altered, hence the twinned marteniste is formed. Figure 1 - Diagram depicting how SMM are able to memorize shapes on a microstructural level3. Left to right: Shape memory alloy in a twinned martensitic phase, SMA phase change to detwinned martensite after mechanical deformation (strain is stored in the material), SMA undergoing phase transformation to parent austenite phase after heating beyond transition temperature (Af), SMA returned to original shape after heating and phase changes to twinned martensite during cooling. Mechanical force can be applied allowing the cycle to be repeated. 1 Liu. C., Qin. H. Mather P.T. (2007.). Review of progress in shape-memory polymers. Retrieved October 3, 2013, from: http://pubs.rsc.org/en/content/articlepdf/2007/jm/b615954k 2 (Liu/Qin/Mather, 2007) 3 Clyne, B., & Shatrova, N. (n.d.). Heating of a shape memory alloy spring. Retrieved October 3, 2013, from University of Cambridge DoITPoMS: http://www.doitpoms.ac.uk/ldplib/shape_memory/printall.php The ability of SMP stems from the intrinsic elasticity of the polymer networks that exist on the microstructural level4. Unlike an SMA, an SMP operates through the use of external forces and temperature to achieve cyclic behavior. A better depiction of this effect can be understood by the SMP cycling depicted by the graph in figure 2. An SMP is heated and constant loading is applied at the elevated temperature, which is depicted by an increase in strain, which is stored within the material. Once the material has been deformed the temperature is subsequently cooled with the loading held constant; this fixes the polymer chains in place. The loading is then removed and the SMP retains the “deformed” shape. In order to return the SMP to the original shape the SMP is heated; the strain stored within the polymer chains is released and the shape returns to the starting point. Figure 2 – Graphical representation of shape memory polymer cycling5. Starting at point (a), Shape memory polymer heated and constant load applied at constant temperature. Deformation followed by cooling at constant load. Loading is then removed and shape fixing occurs. Shape recovered to original format when SMP is heated, i.e. graph ends at point (a). For Ted: Talk about which one we will choose for our report – SMA or SMP Talk about the how to calculate the bending force and actuation force is SMA – Actual Calculation will be in the appendix – This is almost there just need to conform some stuff with Chad Briefly mention where and how other SMA are used Mention the most common types of SMA – Since you were working on the part of justifying the use of SMA it should tie in here as well – The paper I sent you does mention the different SMA and effect on the composition 4 (Liu/Qin/Mather, 2007) 5 (Liu/Qin/Mather, 2007) Calculating Bending in SMA’s Assumptions: The martensite stress-stain curve has to be simplified and is shown as follows: For our calculation we want bending to occur past the yield stress of the material into the plateau region as indicated by the graph above. However during the loading the strain cannot exceed the εmax point, which is the maximum strain that the SMA can handle. Beyond this point the stresses will induce dislocation movement and the material will no longer be able to detwin. The maximum strain can be estimated by the following graph: Graph 1 – Stress-Strain curves of Austenite and Martensite – I don’t have the software to change the graph so that the lines are black εmax = 3.5% The beam bends as depicted in the figure below L – length of arc after bending occurs ρ – radius of bending The force required to bend the material to the detwinning stage is 1N (1N≈100g – 100g is the weight of the aluminum frame) From the graph it is not very clear where the yield point is but for the purposes of this calculations the yield point is estimated at around 120MPa. Equation 1: Force required for bending; this is the force required to bend the material to the detwinnig plateau as indicated on the simplified stress-strain curve. If the force is lower than this the material will not have enough bending and if too much force is applied there will be an excessive permanent plastic deformation. (Equation from Ashby textbook – Appendix B4 / C=1) Ff = CZσ L Equation 2: Equation governing the Z factor from equation 1. Z factor based on thickness (t) and width (h) through which the force is acting (Equation from Ashby textbook – Appendix B2 / C=1) Z ht 2 = L 4L Equation 3: This equation governs the strain on a surface (linear strain) when a beam is subjected to bending. The linear strain cannot exceed 3.5% as this would lead to plastic deformation. εmax 𝑡 𝑡 2 ≤ 3.5% = = 𝜌 2𝜌 Equation 4: This equation is the formula to calculate the arc length. In our case the arc length is the new length formed when bending occurs (the length, L, shown in the diagram) L= 2𝜋𝜌 4 The equations were manipulated as follows to allow for the optimal dimensions to be calculated: Ff = Zσ L → Ff Z = σ L Z Ff ht 2 = = L σ 4L Z Ff ht 2 ht 2 = = = L σ 4 2𝜋𝜌 2𝜋𝜌 4 Z Ff ht 2 ht 2 = = = L σ 4 2𝜋𝜌 2𝜋𝜌 4 Z Ff ht 2 = = 𝑡 L σ 2𝜋 2𝜀 Z Ff = 𝜋 = h𝜀t L σ Using this equation the thickness can be plotted as a function of the width: Ff 1 𝜋( ) = t σ h𝜀 Since F=1N and σ=120Mpa and the ε can be varied the following plot can be derived: 0.03 0.025 Thickness (t) 0.02 ε=1.0% ε=1.5% 0.015 ε=2.0% ε=2.5% 0.01 ε=3.0% ε=3.5% 0.005 0 0 1 2 3 4 5 6 Width (h) The basic correlation is that the greater the width of the wire the lower the thickness since width and thickness are inversely proportional. However as required strain is increased the width and thickness dimensions decrease to achieve the given strain.


