PSYB1_methods2_LessonPlan - King Edward VI Handsworth
advertisement
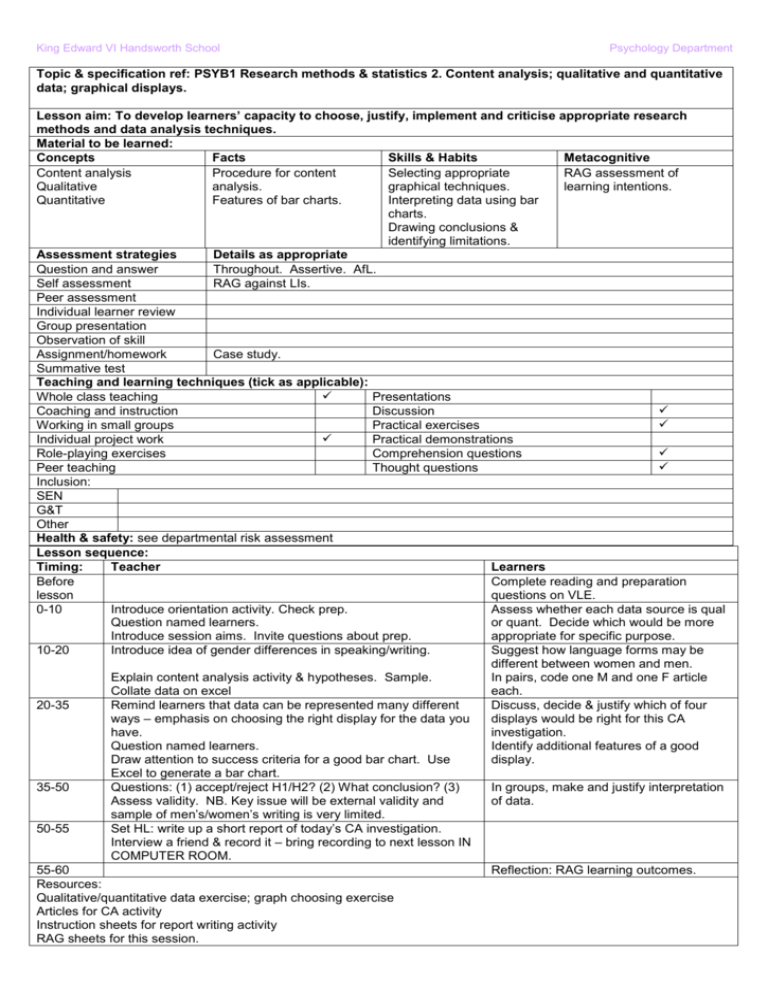
King Edward VI Handsworth School Psychology Department Topic & specification ref: PSYB1 Research methods & statistics 2. Content analysis; qualitative and quantitative data; graphical displays. Lesson aim: To develop learners’ capacity to choose, justify, implement and criticise appropriate research methods and data analysis techniques. Material to be learned: Concepts Facts Skills & Habits Metacognitive Content analysis Procedure for content Selecting appropriate RAG assessment of Qualitative analysis. graphical techniques. learning intentions. Quantitative Features of bar charts. Interpreting data using bar charts. Drawing conclusions & identifying limitations. Assessment strategies Details as appropriate Question and answer Throughout. Assertive. AfL. Self assessment RAG against LIs. Peer assessment Individual learner review Group presentation Observation of skill Assignment/homework Case study. Summative test Teaching and learning techniques (tick as applicable): Whole class teaching Presentations Coaching and instruction Discussion Working in small groups Practical exercises Individual project work Practical demonstrations Role-playing exercises Comprehension questions Peer teaching Thought questions Inclusion: SEN G&T Other Health & safety: see departmental risk assessment Lesson sequence: Timing: Teacher Learners Before Complete reading and preparation lesson questions on VLE. 0-10 Introduce orientation activity. Check prep. Assess whether each data source is qual Question named learners. or quant. Decide which would be more Introduce session aims. Invite questions about prep. appropriate for specific purpose. 10-20 Introduce idea of gender differences in speaking/writing. Suggest how language forms may be different between women and men. Explain content analysis activity & hypotheses. Sample. In pairs, code one M and one F article Collate data on excel each. 20-35 Remind learners that data can be represented many different Discuss, decide & justify which of four ways – emphasis on choosing the right display for the data you displays would be right for this CA have. investigation. Question named learners. Identify additional features of a good Draw attention to success criteria for a good bar chart. Use display. Excel to generate a bar chart. 35-50 Questions: (1) accept/reject H1/H2? (2) What conclusion? (3) In groups, make and justify interpretation Assess validity. NB. Key issue will be external validity and of data. sample of men’s/women’s writing is very limited. 50-55 Set HL: write up a short report of today’s CA investigation. Interview a friend & record it – bring recording to next lesson IN COMPUTER ROOM. 55-60 Reflection: RAG learning outcomes. Resources: Qualitative/quantitative data exercise; graph choosing exercise Articles for CA activity Instruction sheets for report writing activity RAG sheets for this session.


