Optimization of Dehydrogenation to produce Propylene from
advertisement
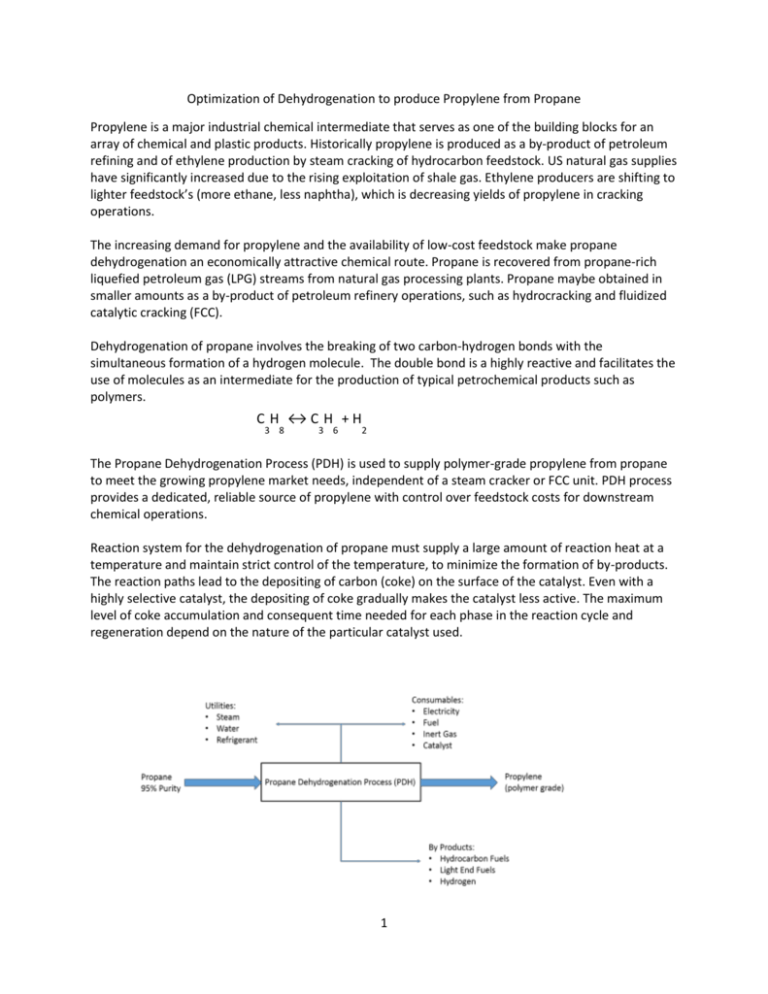
Optimization of Dehydrogenation to produce Propylene from Propane Propylene is a major industrial chemical intermediate that serves as one of the building blocks for an array of chemical and plastic products. Historically propylene is produced as a by-product of petroleum refining and of ethylene production by steam cracking of hydrocarbon feedstock. US natural gas supplies have significantly increased due to the rising exploitation of shale gas. Ethylene producers are shifting to lighter feedstock’s (more ethane, less naphtha), which is decreasing yields of propylene in cracking operations. The increasing demand for propylene and the availability of low-cost feedstock make propane dehydrogenation an economically attractive chemical route. Propane is recovered from propane-rich liquefied petroleum gas (LPG) streams from natural gas processing plants. Propane maybe obtained in smaller amounts as a by-product of petroleum refinery operations, such as hydrocracking and fluidized catalytic cracking (FCC). Dehydrogenation of propane involves the breaking of two carbon-hydrogen bonds with the simultaneous formation of a hydrogen molecule. The double bond is a highly reactive and facilitates the use of molecules as an intermediate for the production of typical petrochemical products such as polymers. C H ↔C H +H 3 8 3 6 2 The Propane Dehydrogenation Process (PDH) is used to supply polymer-grade propylene from propane to meet the growing propylene market needs, independent of a steam cracker or FCC unit. PDH process provides a dedicated, reliable source of propylene with control over feedstock costs for downstream chemical operations. Reaction system for the dehydrogenation of propane must supply a large amount of reaction heat at a temperature and maintain strict control of the temperature, to minimize the formation of by-products. The reaction paths lead to the depositing of carbon (coke) on the surface of the catalyst. Even with a highly selective catalyst, the depositing of coke gradually makes the catalyst less active. The maximum level of coke accumulation and consequent time needed for each phase in the reaction cycle and regeneration depend on the nature of the particular catalyst used. 1 To purge the coke accumulated on the catalyst surface during the reaction either a continuous catalyst regenerator (CCR) or a fixed-bed reactor is required. In the CCR unit the catalyst circulates in moving beds through the reactors, before being fed for regeneration. The CCR operates independently of the reaction, burning off the coke and returning the catalyst to its reduced state. In the fixed-bed reactor process at least two (or more) reactors must be used so that the catalyst in one reactor can be regenerated without stopping the process. The advantage with a moving bed or a fluidized bed is that the catalyst can be continuously removed from the reactor and be regenerated. The disadvantage is that a separate regeneration unit is needed. Steam Propane Dehydrogenration Reaction Gas Compresion & Separation Heat Recovery Propylene Product Fractionation Fuel Gas Propane Recycle Fixed Bed Reactor 1 These processing conditions, together with the thermodynamic and kinetic requirements, have pushed researchers to develop optimal reactor design solutions for the industrial exploitation of dehydrogenation reactions. The available commercial technologies offer different choices as regards the reaction system, tending to simultaneously optimize the reaction conditions and the supply of energy to the reaction. Real-time measurement of process gases and impurities is critical to optimize product conversion, product purity and catalyst regeneration cycles. Process Mass Spectrometry is the premier technology for process gas analysis being able to measure these compounds regardless of the catalyst regeneration process. Some of the primary advantages of Mass Spectrometry are; Primary Analytical Method High Sensitivity and Selectivity Analysis time is less than 10 seconds per stream Measure of multiple reactor on a single analyzer Measure multiple components simultaneously Low Life Cycle Cost of Ownership Web/Server based operating system to interface with DCS 2 Stream Analysis Table: Estimate Concentration Sensitivity Detected Mass RIF RSD(F) RSD(M) STD(F) % % vol. pm HYDROGEN 28.50% 0.175 2 <0.01 0.13 N-BUTANE 0.04% 2 58 0.73 4.03 ETHYLENE 0.70% 1 26 16.22 1.89 132 ETHANE 0.90% 1 30 3.41 1.30 117 PROPANE 39.90% 1 29 <0.01 0.05 190 PROPYLENE 26.40% 1 41 0.21 0.06 170 ISOBUTANE 0.16% 2 43 32.01 3.05 49 1-BUTENE 0.56% 1 56 <0.01 0.63 36 OXYGEN 0.10% 0.98 32 <0.01 0.96 10 METHANE 1.79% 0.698 16 0.05 0.27 o-Xylene 30ppm 2 106 <0.01 6.14 0.82 TOLUENE 30ppm 2 92 0.11 4.87 0.65 BENZENE 0.04% 2 78 <0.01 1.06 N-PENTANE 0.03% 2 72 0.06 5.63 Name STD(M) vol. ppm 383 0.54 16 2.15 49 0.25 0.19 4 0.75 17 0.23 Definition of terms appearing in the evaluation tables. RIF: Relative Interference Factor, (intensity of all interfering ions/intensity of the ion of interest) RSD(F): Relative Standard Deviation (one sigma) as a % of the reported concentration with the use of Faraday Cup detector RSD(M): Relative Standard Deviation (one sigma) as a % of the reported concentration with the use of Electron Multiplier detector STD(F): Standard Deviation (one sigma) in absolute units of concentration with the use of Faraday Cup detector STD(M): Standard Deviation (one sigma) in absolute units of concentration with the use of Electron Multiplier detector 3
