Vostok Ice Core Data lab( 10
advertisement
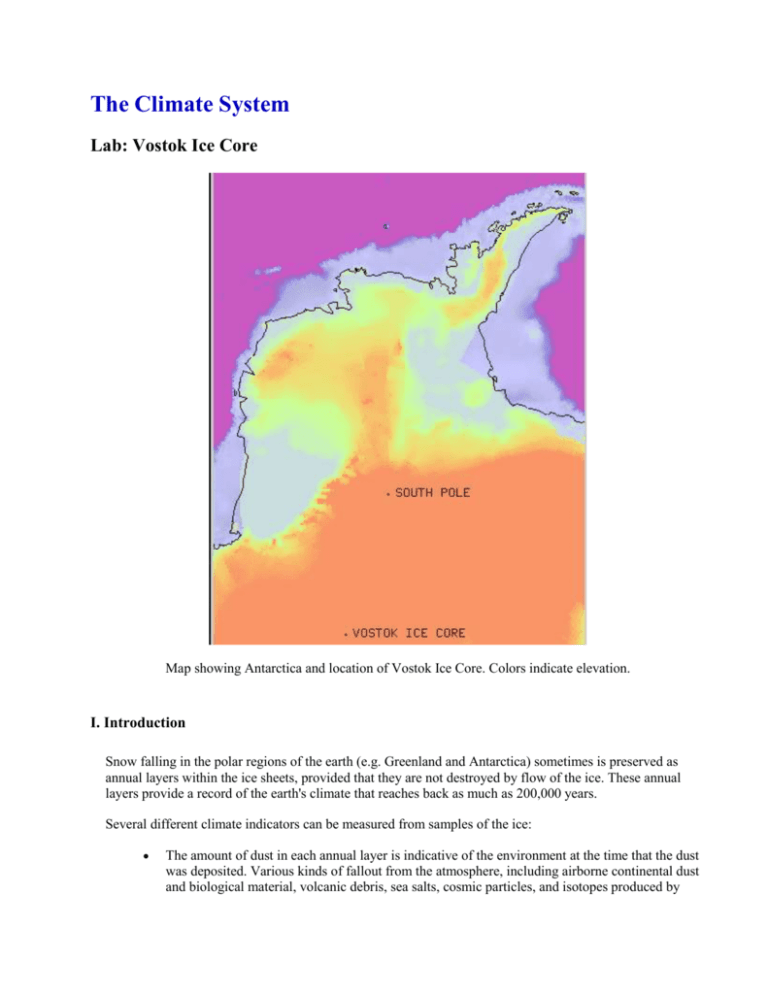
The Climate System Lab: Vostok Ice Core Map showing Antarctica and location of Vostok Ice Core. Colors indicate elevation. I. Introduction Snow falling in the polar regions of the earth (e.g. Greenland and Antarctica) sometimes is preserved as annual layers within the ice sheets, provided that they are not destroyed by flow of the ice. These annual layers provide a record of the earth's climate that reaches back as much as 200,000 years. Several different climate indicators can be measured from samples of the ice: The amount of dust in each annual layer is indicative of the environment at the time that the dust was deposited. Various kinds of fallout from the atmosphere, including airborne continental dust and biological material, volcanic debris, sea salts, cosmic particles, and isotopes produced by cosmic radiation, are deposited on the ice sheet surface along with the snow, thus mixing with the snow and also acting as a distinctive barrier between different ice layers. The composition of bubbles of air trapped in the ice is a measure of the composition of the atmosphere in ancient times. With increasing pressure from subsequent snow deposition on an ice cap or glacier, the snow becomes compacted and, consequently, air is trapped within the deposited layer. This entrapment of air occurs essentially with no differentiation of the atmospheric gas components. However, carbon dioxide has different chemical properties from other atmospheric gases, thus, the carbon dioxide concentration in the air-filled spaces might be affected by interaction with the ice itself or with trapped impurities. The isotopic composition of water, and in particular the concentration of the heavy isotope of oxygen, 18O, relative to 16O, as well as 2H (deuterium, D) relative to 1H, is indicative of the temperatures of the environment. During cold periods, the concentration of less volatile 2H (18O) in the ice is lower than during warm periods. The reason for this is that at lower temperature, the moisture has been removed from the atmosphere to a larger degree resulting in an increased depletion of the heavier isotopes. The Vostok core was drilled in East Antarctica, at the Soviet station Vostok from an altitude of 3488 m, and has a total length of 2083 m. Ice samples have been analyzed with respect to isotopic content in 2H, dust, and methane and carbon dioxide trapped in air bubbles. The profiles of 2H, methane, and carbon dioxide concentrations behave in a similar way with respect to depth in the core, showing a short interglacial stage, the Holocene, at the top, a long glacial stage below, and the last interglacial stage near the bottom of the core. The record goes back in time about 160,000 years. II. Lab Instructions Purpose The aim of this lab investigation is to use the National Climatic Database (NCD) of the US Department of Commerce to investigate changes in atmospheric greenhouse gas concentrations and climate temperature. For the purposes of the lab, assume that the most shallow ice core measurements represent the environmental conditions in the 18th century before the Industrial Revolution. Gas Age vs. Ice Age Age is calculated in two different ways within an ice core. The ice age is calculated from an analysis of annual layers in the top part of the core, and using an ice flow model for the bottom part. The gas age data accounts for the fact that gas is only trapped in the ice at a depth well below the surface where the pores close up. Task 1: δD (Change in Deuterium) as a proxy for temperature Transfer the Vostok ice core data (vos_data.tsv) to Excel, and save it as an Excel workbook Next you will calculate the temperature based on the isotopic composition of the ice. Insert a blank column into the table to the right of the delta-deuterium column (δD). Isotopic ratios are used to model temperature. Calculate the temperature at Vostok based on the following formula describing the empirical relationship between temperature and deuterium concentration: Temperature (deg-C) = -55.5 + (δD + 440) / 6 *Be sure to save your work!* Now plot your calculated temperature vs. ice age. 1. How reliable do you consider this paleoclimate record to be? (Hint: think about some of the uncertainties in the age models and compare the age of the Last Glacial Maximum (LGM) to what scientists consider the age to be today.) The Last Glacial Maximum occurred when the ice sheets were at their most recent maximum extension. 2. How long ago did the maximum temperature occur? 3. How long ago did the minimum temperature occur? 4. How do these temperatures compare to the current average Vostok temperature? Task 2: Analysing atmospheric conctrations of CO2, CH4, and Dust Plot CO2 as a function of gas age. Now plot CO2 against temperature. Add a trendline and record the R2 value. Make the same plots for CH4. Now make a plot of dust as a function of ice age. Compare this to the temperature plot. 5. How closely does the plot of CO2 resemble that of temperature? 6. Do you think this correlation is significant? Think about the meaning of the R2 value. 7. Is CO2 or CH4 more closely correlated with temperature? 8. Why do you think that is? 9. How well do the changes in dust concentration correlate with the temperature changes? 10. Why were CO2, CH4, and dust concentrations different during the glacial time as compared to the 18th century? Note that there were two major warming events representing two deglaciations in the Vostok calculated temperature data. Then look at how CO2 and CH4 change during those deglaciation periods. 12. From the data provided in this lab, can you tell which changes first, temperature or greenhouse gas (CO2, CH4) concentrations? 13. Why is this important? III. Lab Report Instructions Email your graphs along with the answers to the thirteen questions in a word document. Make sure that the graphs generated are the same size for the horizontal axis for easier comparison. In addition, address the following question based on the following article: Positive Feedback Ocean warming provides a good example of a potential positive feedback mechanism. The oceans are an important sink for CO2 through absorption of the gas into the water surface. As CO2 increases it increases the warming potential of the atmosphere. If air temperatures warm it should warm the oceans. The ability of the ocean to remove CO2 from the atmosphere decreases with increasing temperature. Hence increasing CO2 in the atmosphere could have effects that exacerbate the increase in CO2 in the atmosphere. (Carpenter) 14. Explain the relationship between the ocean and atmospheric carbon dioxide levels.


