Lab Instructions: Vostok Ice Core
advertisement
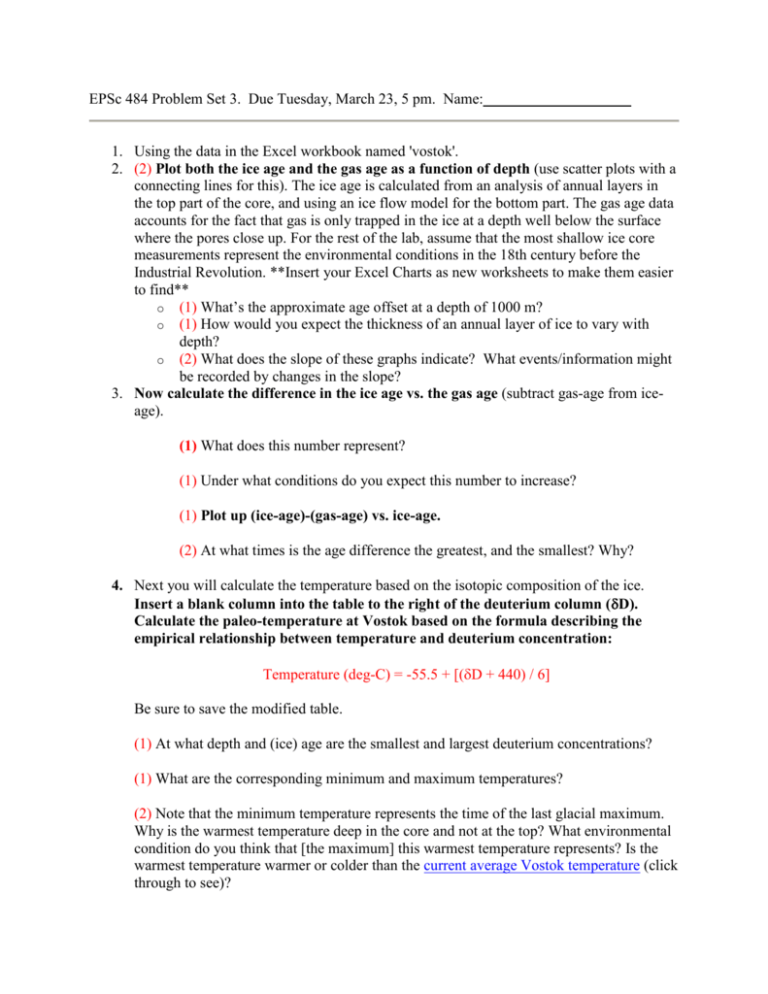
EPSc 484 Problem Set 3. Due Tuesday, March 23, 5 pm. Name: 1. Using the data in the Excel workbook named 'vostok'. 2. (2) Plot both the ice age and the gas age as a function of depth (use scatter plots with a connecting lines for this). The ice age is calculated from an analysis of annual layers in the top part of the core, and using an ice flow model for the bottom part. The gas age data accounts for the fact that gas is only trapped in the ice at a depth well below the surface where the pores close up. For the rest of the lab, assume that the most shallow ice core measurements represent the environmental conditions in the 18th century before the Industrial Revolution. **Insert your Excel Charts as new worksheets to make them easier to find** o (1) What’s the approximate age offset at a depth of 1000 m? o (1) How would you expect the thickness of an annual layer of ice to vary with depth? o (2) What does the slope of these graphs indicate? What events/information might be recorded by changes in the slope? 3. Now calculate the difference in the ice age vs. the gas age (subtract gas-age from iceage). (1) What does this number represent? (1) Under what conditions do you expect this number to increase? (1) Plot up (ice-age)-(gas-age) vs. ice-age. (2) At what times is the age difference the greatest, and the smallest? Why? 4. Next you will calculate the temperature based on the isotopic composition of the ice. Insert a blank column into the table to the right of the deuterium column (D). Calculate the paleo-temperature at Vostok based on the formula describing the empirical relationship between temperature and deuterium concentration: Temperature (deg-C) = -55.5 + [(D + 440) / 6] Be sure to save the modified table. (1) At what depth and (ice) age are the smallest and largest deuterium concentrations? (1) What are the corresponding minimum and maximum temperatures? (2) Note that the minimum temperature represents the time of the last glacial maximum. Why is the warmest temperature deep in the core and not at the top? What environmental condition do you think that [the maximum] this warmest temperature represents? Is the warmest temperature warmer or colder than the current average Vostok temperature (click through to see)? (1) Now make a scatter plot of (ice-age)-(gas-age) vs. temperature, and insert a trendline. (2) Explain the relationship you observe. Do you expect (ice-age)-(gas-age) difference to increase or decrease in the future? 5. (1) Prepare plots of CO2 and CH4 concentration as a function of (gas) age (use a scatter plot with a connecting line for this). Put age on the x-axis. You can put them both on the same plot and just adjust the scale for the secondary axis. (1) On a separate page plot temperature and dust as a function of (ice) age -- remember to use the same scale on the x-axis as you used for the gas concentration plots. (2) Compare the plots and describe how and why the CO2, CH4, and dust change relative to temperature. 6. (1) Pre-Industrial atmospheric CO2 and CH4 concentrations can be found at the Current Greenhouse Gas Concentrations website. Calculate the changes in CO2 and CH4 concentrations between the last glacial maximum and the 18th century, and between the 18th century and today. 7. (2)Create scatter plots (without connecting lines) of CO2 vs. temperature and CH4 vs. temperature using the Vostok data. Insert a linear "trendline" and report the equation and r2 value for each of these scatter plots. (2)Which is better correlated (has a higher r2 value) with temperature, CO2 or CH4? Why do you think that this might be the case? (2)Insert today's CO2 concentration into the linear regression equation to estimate what the past relationship between CO2 and temperature predicts that today's temperature should be at Vostok. How do you explain the difference between the predicted warming at Vostok and the global temperature increase that has actually occurred since the Industrial Revolution? 8. (2)What is the most rapid warming that occurred during the deglaciation that began around 15,000-20,000 years ago and when was it? Hint: calculate the rate of change of temperature (degrees/ka) for each core increment. 9. (2) What are the most rapid rates of change in greenhouse gas concentrations for this time period (carbon dioxide (ppmv/ka ) and methane (ppbv/ka)) and when were they? 10. (2) How do these rates of change compare with recent warming (~0.6 degrees C from 1975-2005) and increases in greenhouse gas concentrations (use data at http://cdiac.esd.ornl.gov/pns/current_ghg.html, calculate rate of change between 1750 and “recent”; most data will not be 100% current but you can calculate as if for 2010)? 11. (2) Note the time of the two major warming events representing deglaciations. Then look at how CO2 and CH4 change during the same time. From the data provided in this lab, can you tell which changes first, temperature or greenhouse gas (CO2, CH4) composition? What would you need to figure it out?
