BRKB Full Report
advertisement

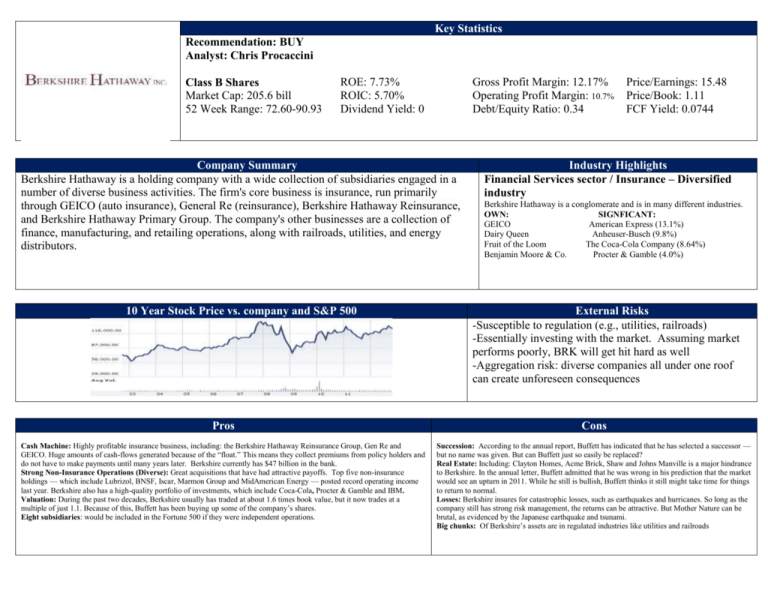
Key Statistics Recommendation: BUY Analyst: Chris Procaccini Class B Shares Market Cap: 205.6 bill 52 Week Range: 72.60-90.93 ROE: 7.73% ROIC: 5.70% Dividend Yield: 0 Gross Profit Margin: 12.17% Operating Profit Margin: 10.7% Debt/Equity Ratio: 0.34 Price/Earnings: 15.48 Price/Book: 1.11 FCF Yield: 0.0744 Company Summary Berkshire Hathaway is a holding company with a wide collection of subsidiaries engaged in a number of diverse business activities. The firm's core business is insurance, run primarily through GEICO (auto insurance), General Re (reinsurance), Berkshire Hathaway Reinsurance, and Berkshire Hathaway Primary Group. The company's other businesses are a collection of finance, manufacturing, and retailing operations, along with railroads, utilities, and energy distributors. Industry Highlights Financial Services sector / Insurance – Diversified industry 10 Year Stock Price vs. company and S&P 500 External Risks -Susceptible to regulation (e.g., utilities, railroads) -Essentially investing with the market. Assuming market performs poorly, BRK will get hit hard as well -Aggregation risk: diverse companies all under one roof can create unforeseen consequences Berkshire Hathaway is a conglomerate and is in many different industries. OWN: SIGNFICANT: GEICO American Express (13.1%) Dairy Queen Anheuser-Busch (9.8%) Fruit of the Loom The Coca-Cola Company (8.64%) Benjamin Moore & Co. Procter & Gamble (4.0%) Pros Cons Cash Machine: Highly profitable insurance business, including: the Berkshire Hathaway Reinsurance Group, Gen Re and GEICO. Huge amounts of cash-flows generated because of the “float.” This means they collect premiums from policy holders and do not have to make payments until many years later. Berkshire currently has $47 billion in the bank. Strong Non-Insurance Operations (Diverse): Great acquisitions that have had attractive payoffs. Top five non-insurance holdings — which include Lubrizol, BNSF, Iscar, Marmon Group and MidAmerican Energy — posted record operating income last year. Berkshire also has a high-quality portfolio of investments, which include Coca-Cola, Procter & Gamble and IBM. Valuation: During the past two decades, Berkshire usually has traded at about 1.6 times book value, but it now trades at a multiple of just 1.1. Because of this, Buffett has been buying up some of the company’s shares. Eight subsidiaries: would be included in the Fortune 500 if they were independent operations. Succession: According to the annual report, Buffett has indicated that he has selected a successor — but no name was given. But can Buffett just so easily be replaced? Real Estate: Including: Clayton Homes, Acme Brick, Shaw and Johns Manville is a major hindrance to Berkshire. In the annual letter, Buffett admitted that he was wrong in his prediction that the market would see an upturn in 2011. While he still is bullish, Buffett thinks it still might take time for things to return to normal. Losses: Berkshire insures for catastrophic losses, such as earthquakes and hurricanes. So long as the company still has strong risk management, the returns can be attractive. But Mother Nature can be brutal, as evidenced by the Japanese earthquake and tsunami. Big chunks: Of Berkshire’s assets are in regulated industries like utilities and railroads Company Overview Berkshire Hathaway Inc. is an American multinational conglomerate holding company headquartered in Omaha, Nebraska, United States with a wide collection of subsidiaries engaged in a number of diverse business activities. The firm's core business is insurance, run primarily through GEICO (auto insurance), General Re (reinsurance), Berkshire Hathaway Reinsurance, and Berkshire Hathaway Primary Group. Berkshire originally focused on longterm investments in publicly quoted stocks, but more recently has turned to buying whole companies. Berkshire now owns a diverse range of businesses including confectionery, retail, railroad, home furnishings, encyclopedias, manufacturers of vacuum cleaners, jewelry sales; newspaper publishing; manufacture and distribution of uniforms; as well as several regional electric and gas utilities. The company averaged an annual growth in book value of 20.3% to its shareholders for the last 44 years, while employing large amounts of capital, and minimal debt. Berkshire Hathaway stock produced a total return of 76% from 2000–2010 versus a negative 11.3% return for the S&P 500. History Berkshire Hathaway traces its roots to a textile manufacturing company established by Oliver Chace in 1839 as the Valley Falls Company in Valley Falls, Rhode Island. In 1929 the Valley Falls Company merged with the Berkshire Cotton Manufacturing Company established in 1889, in Adams, Massachusetts. The combined company was known as Berkshire Fine Spinning Associates. In 1955 Berkshire Fine Spinning Associates merged with the Hathaway Manufacturing Company which was founded in 1888 in New Bedford, Massachusetts by Horatio Hathaway. Hathaway was successful in its first decades, but it suffered during a general decline in the textile industry after World War I. After the merger Berkshire Hathaway had 15 plants employing over 12,000 workers with over $120 million in revenue. However, seven of those locations were closed by the end of the decade, accompanied by large layoffs. In 1962, Warren Buffett began buying stock in Berkshire Hathaway after noticing a pattern in the price direction of its stock whenever the company closed a mill. Eventually, Buffett acknowledged that the textile business was waning and the company's financial situation was not going to improve. However, Buffett decided to buy more of the stock to take control of the company and was now majority owner of a textile business that was failing. Buffett initially maintained Berkshire's core business of textiles, but by 1967, he was expanding into the insurance industry and other investments. Berkshire first ventured into the insurance business with the purchase of National Indemnity Company. In the late 1970s, Berkshire acquired an equity stake in the Government Employees Insurance Company (GEICO), which forms the core of its insurance operations today (and is a major source of capital for Berkshire Hathaway's other investments). In 1985, the last textile operations (Hathaway's historic core) were shut down. Subsidiary Breakdown Subsidiaries Company Sector Acquisition Date Company Sector Acquisition Date GEICO Insurance and Finance 1996 Clayton Homes Materials and Construction 2007 Applied Underwriters Insurance and Finance 2004 ISCAR Metalworking Materials and Construction 2006 General Re Insurance and Finance 1995 Johns Manville Materials and Construction 2001 Kansas Bankers Surety Company Insurance and Finance 1998 MiTek Materials and Construction 2001 National Indemnity Company Insurance and Finance 1977 Precision Steel Warehouse, Inc. Materials and Construction 1979 United States Liability Insurance Group Insurance and Finance 2000 Shaw Industries Materials and Construction 2002 Central States Indemnity Company Insurance and Finance 1982 The Buffalo News Media 1977 Wesco Financial Corporation Insurance and Finance 1978 Business Wire Media 2006 Dairy Queen Food and Beverage 1997 Omaha World-Herald Media 2011 The Pampered Chef Food and Beverage 2002 XTRA Corporation Logistics 2001 See's Candies Food and Beverage 1972 McLane Company Logistics 2003 Fechheimer Brothers Company Clothing 1986 Ben Bridge Jewelers Luxury Items 2000 Fruit of the Loom Clothing 2002 Borsheim's Fine Jewelry Luxury Items 1989 Garan Children's Clothing Clothing 2002 Helzberg Diamonds Luxury Items 1995 H.H. Brown Shoe Group Clothing 1991 Scott Fetzer Companies Other 1985 Justin Brands Clothing 2000 MidAmerican Energy Holdings Company Utilities 1999 CORT Business Services Furniture Related 2000 NetJets Business Services 1998 Jordan's Furniture Furniture Related 1999 NetJets Europe Business Services 1998 Larson-Juhl Furniture Related 2001 FlightSafety Business Services 1997 Nebraska Furniture Mart Furniture Related 1983 CTB Inc. Capital Goods 2002 RC Willey Home Furnishings Furniture Related 1995 Burlington Northern Santa Fe Corp. Railroads and Logistics 2010 Star Furniture Furniture Related Materials and Construction Materials and Construction 1997 Blue Chip Stamps Other 1983 2000 SE Homes Materials and Construction 2007 2001 Cavalier Homes Materials and Construction 2008 Acme Brick Company Benjamin Moore & Co. Significant Minority Holdings Company Sector Acquisition Date Ownership % American Express Insurance and Finance 13.10% 2005 M&T Bank Insurance and Finance 15.9% of common stock Anheuser-Busch Food and Beverage 9.80% 2005 The Coca-Cola Company Food and Beverage 8.64% 2009 The Washington Post Company Media 18.10% 2004 Procter & Gamble Consumer Goods 4.00% 2005 IBM Technology 5.50% 2012 Business Risks There are a few business risks surrounding Berkshire Hathaway that are worth noting. For one, Berkshire Hathaway is susceptible to laws and regulations. Meaning the subsidiaries it invests in- or owns outright- are exposed to any new law passed or regulation imposed on a specific industry, potentially impacting the industry negatively. Companies like MidAmerican Energy Holdings Company (utilities) or Burlington Northern Santa Fe Corp (railroad), constitute a significant portion of Berkshire’s holdings and large amounts of capital are therefore invested in them. For instance, a new law was recently passed and is to be put in effect within the next couple of year, forcing all trains to have air brakes for safety precautions. This law means an increase in spending for railroad companies and lower margins. The succession at Berkshire Hathaway is, of course, probably the most significant risk. According to the annual report, Buffett has indicated that he has selected a successor — but no name was given. The question is, can Buffett just so easily be replaced? Many investors invest with Berkshire simply because they outright trust Buffett to do right by their money. The methodology of valuation practiced by Buffett and Charlie Munger is instilled at Berkshire Hathaway, and while we should be wary of an initial drop-off in stock price, the long term investing practice should be here to stay. The Real Estate investments at Berkshire have been a dark spot on an otherwise clean slate. The investments include: Clayton Homes, Acme Brick, Shaw and Johns Manville- all major hindrances to Berkshire. Again, in the annual letter, Buffett admitted that he was wrong in his prediction that the market would see an upturn in 2011. While he still is bullish, Buffett thinks it still might take time for things to return to normal. As with anything, investments can be bad as well. While they have yet to pay-off today, Buffett is optimistic about Real Estate in the future. Berkshire’s cash machine, the money it uses to finance its investments, comes from its insurance part of the business. Just as with any insurance company, and particularly with Berkshire due to it being mainly invested in catastrophic losses, whenever there is a catastrophe (earthquake, hurricane, tsunami, etc), there will be losses. So long as the company still has strong risk management, the returns can be attractive. But Mother Nature can be brutal, as evidenced by the Japanese earthquake and tsunami. These events are for the most part unpredictable. If there are floods, we hope the company stays above water, however. Lastly, the idea of aggregation risk exists as well. These are diverse companies all under one roof and this can create unforeseen consequences. It would be rare that all these companies preform exceptionally well each day and how they rely on one another and move with the market is of course always something to keep an eye on. Selected Financial Data Year over Year Growth (%) Revenue Income before Income Taxes Net Income EPS 2003 50.78% 86.79% 90.18% 89.80% 2004 16.48% -9.02% -10.34% -10.48% 2005 9.79% 12.18% 16.69% 16.52% 2006 20.67% 36.76% 29.16% 28.87% 2007 20.00% 20.16% 19.95% 19.60% 2008 -8.85% -62.43% -62.20% -62.21% 2009 4.37% 52.52% 61.29% 61.06% 2010 21.06% 64.92% 60.98% 52.47% 2011 5.51% -19.62% -20.92% -21.62% 2012 8.36% 30.17% 29.91% 29.89% 2003 12.76% 0.36 4.66% 11.51% 10.19% 2004 9.83% 0.40 3.96% 8.94% 8.06% 2005 10.44% 0.42 4.41% 9.62% 8.50% 2006 11.18% 0.44 4.93% 11.02% 8.92% 2007 11.17% 0.45 5.07% 11.53% 8.94% 2008 4.63% 0.40 1.85% 4.34% 3.32% 2009 7.16% 0.40 2.85% 6.70% 5.11% 2010 9.52% 0.41 3.87% 8.99% 6.74% 2011 7.14% 0.38 2.68% 6.37% 4.65% 2012 8.56% 0.38 3.29% 7.73% 5.70% Profitability Ratios Net Margin (%) Asset Turnover (Average) Return on Asset (%) Return on Equity (%) Return on Invested Capital (%) Valuation and Investment Thesis Berkshire Hathaway Common Stock Class B shares currently (11/21/12) trade at 87.58 with a book value of 78.55. That is 1.1x book value. Historically Berkshire has always traded at 1.6x book value. When a stock trades at essentially 1x book value, which it currently is, what that essentially says is Berkshire is earning just the cost of capital and the market is giving it no benefit for future growth. Said another way, the market has placed no value in Berkshire and the companies it owns (like General Re and Dairy Queen) and its portfolio (containing the like of Coke and IBM) have 0% growth for the future. Buffett in his last letter to the shareholders stated he thought the stock was undervalued and subsequently purchased $67 million worth in a stock buyback. What further prompted this investment is that the fiscal cliff is approaching and what Buffett has done is stockpiled nearly $50 billion in cash. He is ready to pounce on stocks as investors begin to sell them off in an attempt to avoid capital gains tax hikes after the end of this year. There will be undervalued stocks and companies in the market and Berkshire has enough cash on hand to buy anything it so desires. Berkshire continues to expand while taking on little to no debt, in large part due to the fact that it is able to finance its own acquisitions through the cash flows of its insurance companies. Year Book Value Price P/Book Value 2010 2009 2008 2007 2006 2005 2004 2003 2002 2001 2000 1999 1998 1997 1996 1995 1994 1993 1992 1991 1990 1989 1988 1987 1986 1985 95,453 84,487 70,530 78,008 70,281 59,377 55,824 50,498 41,727 37,920 40,442 37,987 37,801 25,488 19,011 14,426 10,083 8,854 7,745 6,437 4,612 4,296 2,975 2,477 2,073 1,644 119,100 99,200 96,600 141,600 109,990 88,620 87,900 84,250 72,690 75,600 71,000 56,100 70,000 46,000 34,100 32,100 20,400 16,325 11,750 9,050 6,675 8,675 4,700 2,950 2,870 2,470 1.25 1.17 1.37 1.82 1.57 1.49 1.57 1.67 1.74 1.99 1.76 1.48 1.85 1.8 1.79 2.23 2.02 1.84 1.52 1.41 1.45 2.02 1.58 1.19 1.36 1.5 Avg. = 1.63


