Table S1. Summary of habitat and food resources (Simpson, Shrub
advertisement
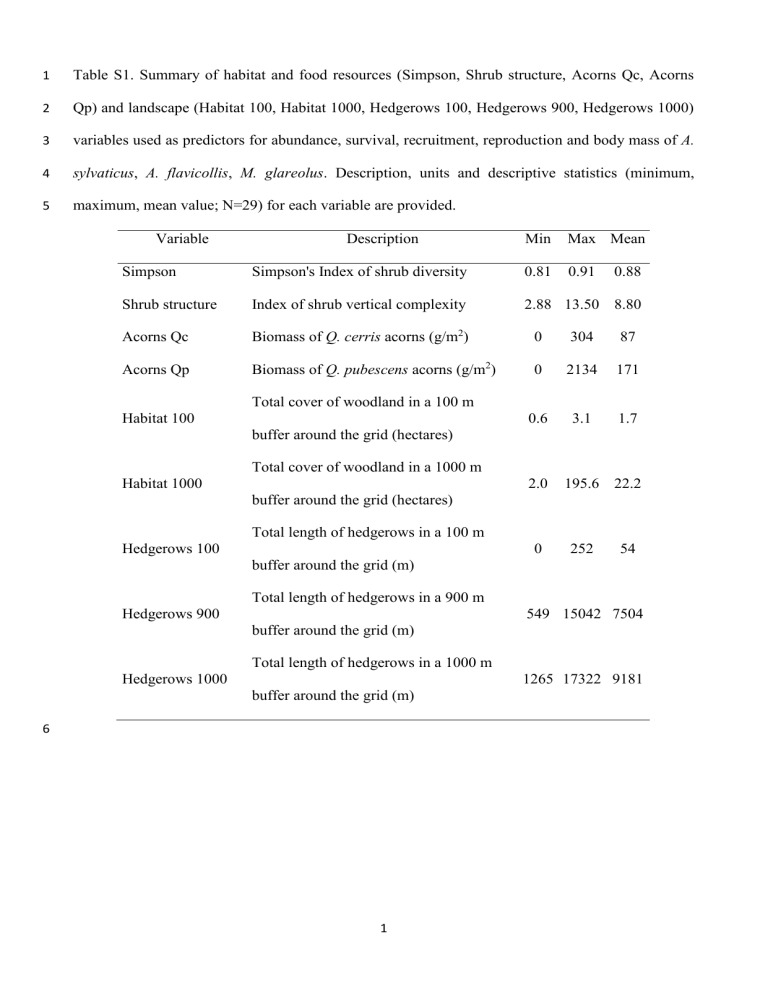
1 Table S1. Summary of habitat and food resources (Simpson, Shrub structure, Acorns Qc, Acorns 2 Qp) and landscape (Habitat 100, Habitat 1000, Hedgerows 100, Hedgerows 900, Hedgerows 1000) 3 variables used as predictors for abundance, survival, recruitment, reproduction and body mass of A. 4 sylvaticus, A. flavicollis, M. glareolus. Description, units and descriptive statistics (minimum, 5 maximum, mean value; N=29) for each variable are provided. Variable Description Min Max Mean 0.91 Simpson Simpson's Index of shrub diversity 0.81 0.88 Shrub structure Index of shrub vertical complexity 2.88 13.50 8.80 Acorns Qc Biomass of Q. cerris acorns (g/m2) 0 304 87 Acorns Qp Biomass of Q. pubescens acorns (g/m2) 0 2134 171 0.6 3.1 1.7 Total cover of woodland in a 100 m Habitat 100 buffer around the grid (hectares) Total cover of woodland in a 1000 m Habitat 1000 2.0 195.6 22.2 buffer around the grid (hectares) Total length of hedgerows in a 100 m Hedgerows 100 0 252 54 buffer around the grid (m) Total length of hedgerows in a 900 m Hedgerows 900 549 15042 7504 buffer around the grid (m) Total length of hedgerows in a 1000 m Hedgerows 1000 1265 17322 9181 buffer around the grid (m) 6 1 7 Table S2. Ranking of GLMMs (Poisson distribution, log link) on individual abundance as a 8 function of habitat and landscape variables. AICc = Akaike's Information Criterion; AICc Wgt = 9 Akaike's weight. Habitat 1000 and Habitat 100 = woodland cover (hectares) in a 1000 or 100 m 10 buffer around the grid; Simpson = shrub diversity index; Acorns Qc = biomass of Q. cerris acorns 11 (g/m2); Acorns Qp = biomass of Q. pubescens acorns (g/m2); Hedgerows 900 and Hedgerows 100 = 12 total length of hedgerows (m) in a 900 or 100 m buffer around the grid; Shrub structure = index of 13 vertical complexity of shrubs. Models > 10 delta AICc are not shown. Model Delta AICc AICc Wgt Habitat 1000 + Simpson + Acorns Qp + Acorns Qc 0.00 0.84 Habitat 1000 + Acorns Qp + Acorns Qc 4.23 0.10 Habitat 1000 + Acorns Qp + Simpson 6.71 0.03 Simpson + Acorns Qp + Acorns Qc 7.95 0.02 Habitat 100 + Acorns Qc + Hedgerows 900 0.00 0.21 Habitat 100 + Acorns Qc 0.10 0.20 Habitat 100 + Acorns Qc + Simpson 1.07 0.12 Habitat 100 + Hedgerows 900 1.37 0.11 Habitat 100 1.60 0.09 Habitat 100 + Simpson + Acorns Qc + Hedgerows 900 1.75 0.09 Habitat 100 + Simpson 2.36 0.06 Habitat 100 + Simpson + Hedgerows 900 2.86 0.05 Simpson + Acorns Qc + Hedgerows 900 5.00 0.02 Acorns Qc + Simpson 5.14 0.02 Acorns Qc + Hedgerows 900 5.94 0.01 Simpson + Hedgerows 900 6.83 0.01 A. sylvaticus A. flavicollis 2 Simpson 7.10 0.01 Acorns Qc 7.38 0.01 Hedgerows 900 8.01 0.00 Constant 9.54 0.00 Hedgerows 100 + Acorns Qp + Shrub structure 0.00 0.91 Shrub structure + Acorns Qp 5.35 0.06 Hedgerows 100 + Acorns Qp 7.61 0.02 Acorns Qp 8.85 0.01 M. glareolus 14 3 15 Table S3. Ranking of models on a) survival (phi) and recruitment (f), b) body mass, c) reproduction 16 probability of females (repr) and d) population density (n) of each species as functions of 17 conspecifics (highlighted with an asterisk) and interspecific competitors. As = A. sylvaticus; Af = 18 A. flavicollis; Mg = M. glareolus. AICc = Akaike's Information Criterion; AIC Wgt = Akaike's 19 weight. Models > 2 delta AICc are not shown. a) Survival and recruitment Model Delta AICc AIC Wgt A. sylvaticus phi (Af+As*) f (Af+As*) 0.00 0.25 phi (Af+As*) f (Mg+Af+As*) 0.29 0.21 phi (Mg+Af+As*) f (Af+As*) 0.71 0.17 phi (Af+As*) f (Af) 0.79 0.17 phi (Mg+Af+As*) f (Af) 1.81 0.10 phi (Af+As*) f (Mg+Af) 1.92 0.09 phi (As+Af*) f (As+Af*) 0.00 0.35 phi (As+Mg+Af*) f (As+Af*) 0.12 0.33 phi (As+Af*) f (As+Mg+Af*) 1.19 0.19 phi (Af) f (As+Af) 0.00 0.22 phi (As+Af) f (As+Af) 0.78 0.15 phi (Af+Mg*) f (As+Af) 1.47 0.11 phi (Af) f (As+Af+Mg*) 1.57 0.10 delta AICc AIC Wgt A. flavicollis M. glareolus b) Body mass Model 4 A. sylvaticus mass (Mg) 0.00 0.32 mass (As*+Mg) 0.26 0.28 mass (Af+Mg) 0.81 0.21 mass (As*+Af+Mg) 1.86 0.12 mass (As+Mg) 0.00 0.50 mass (As) 1.60 0.23 mass (Af*+As+Mg) 1.98 0.19 mass (Mg*+As) 0.00 0.55 mass (Mg*+As+Af) 1.65 0.24 delta AICc AIC Wgt repr (Mg) 0.00 0.24 repr (Af) 0.18 0.22 repr (Af+Mg) 1.07 0.14 repr (As*) 1.08 0.14 repr (As+Mg) 0.00 0.32 repr (As) 0.44 0.26 repr (Af*+As+Mg) 0.73 0.22 repr (Af*+As) 1.01 0.19 A. flavicollis M. glareolus c) Reproduction probability of females Model A. sylvaticus A. flavicollis M. glareolus 5 repr (Af) 0.00 0.30 repr (As+Af) 0.46 0.24 repr (As) 1.17 0.17 repr (Mg*+Af) 1.89 0.12 Delta AICc AIC Wgt 0 0.59 0.73 0.41 0 0.7 1.71 0.3 0 0.96 6.64 0.03 d) Population density Model A. sylvaticus n (Mg) n (Af+Mg) A. flavicollis n (As) n (As+Mg) M. glareolus n (As+Af) n (Af) 20 6
![the Hedgerows Factsheet [MSWORD 2007 16kb]](http://s3.studylib.net/store/data/006673671_1-d612e3440b4640173c263081aea7871b-300x300.png)


