Table 1. Reimbursement approval year for indications of 13 anti
advertisement
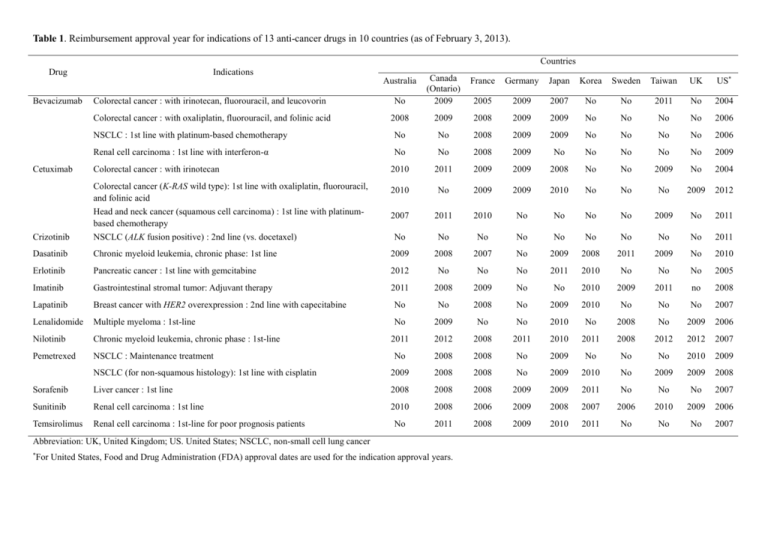
Table 1. Reimbursement approval year for indications of 13 anti-cancer drugs in 10 countries (as of February 3, 2013). Countries Drug Indications Colorectal cancer : with irinotecan, fluorouracil, and leucovorin No Canada (Ontario) 2009 Colorectal cancer : with oxaliplatin, fluorouracil, and folinic acid 2008 2009 2008 2009 2009 No No No No 2006 NSCLC : 1st line with platinum-based chemotherapy No No 2008 2009 2009 No No No No 2006 Renal cell carcinoma : 1st line with interferon-α No No 2008 2009 No No No No No 2009 Australia Bevacizumab France Germany Japan Korea Sweden Taiwan UK US* 2005 2009 2007 No No 2011 No 2004 Cetuximab Colorectal cancer : with irinotecan 2010 2011 2009 2009 2008 No No 2009 No 2004 2010 No 2009 2009 2010 No No No 2009 2012 2007 2011 2010 No No No No 2009 No 2011 Crizotinib Colorectal cancer (K-RAS wild type): 1st line with oxaliplatin, fluorouracil, and folinic acid Head and neck cancer (squamous cell carcinoma) : 1st line with platinumbased chemotherapy NSCLC (ALK fusion positive) : 2nd line (vs. docetaxel) No No No No No No No No No 2011 Dasatinib Chronic myeloid leukemia, chronic phase: 1st line 2009 2008 2007 No 2009 2008 2011 2009 No 2010 Erlotinib Pancreatic cancer : 1st line with gemcitabine 2012 No No No 2011 2010 No No No 2005 Imatinib Gastrointestinal stromal tumor: Adjuvant therapy 2011 2008 2009 No No 2010 2009 2011 no 2008 Lapatinib Breast cancer with HER2 overexpression : 2nd line with capecitabine No No 2008 No 2009 2010 No No No 2007 Lenalidomide Multiple myeloma : 1st-line No 2009 No No 2010 No 2008 No 2009 2006 Nilotinib Chronic myeloid leukemia, chronic phase : 1st-line 2011 2012 2008 2011 2010 2011 2008 2012 2012 2007 Pemetrexed NSCLC : Maintenance treatment No 2008 2008 No 2009 No No No 2010 2009 NSCLC (for non-squamous histology): 1st line with cisplatin 2009 2008 2008 No 2009 2010 No 2009 2009 2008 Sorafenib Liver cancer : 1st line 2008 2008 2008 2009 2009 2011 No No No 2007 Sunitinib Renal cell carcinoma : 1st line 2010 2008 2006 2009 2008 2007 2006 2010 2009 2006 Temsirolimus Renal cell carcinoma : 1st-line for poor prognosis patients No 2011 2008 2009 2010 2011 No No No 2007 Abbreviation: UK, United Kingdom; US. United States; NSCLC, non-small cell lung cancer * For United States, Food and Drug Administration (FDA) approval dates are used for the indication approval years. Table 2. Representative incremental cost-effectiveness ratio for each drug indication in increasing order ICER ( in US$)* Drug Indications Nilotinib Chronic myeloid leukemia, chronic phase : 1st-line 17,314 Imatinib Gastrointestinal stromal tumor: Adjuvant therapy 29,591 Cetuximab Colorectal cancer (K-RAS wild type): 1st line with oxaliplatin, fluorouracil, and folinic acid 42,026 Pemetrexed NSCLC (for non-squamous histology): 1st line with cisplatin 44,451 Lenalidomide Multiple myeloma : 1st-line 68,941 Pemetrexed NSCLC : Maintenance treatment 73,978 Sorafenib Liver cancer : 1st line 82,792 Sunitinib Renal cell carcinoma : 1st line 85,572 Lapatinib Breast cancer with HER2 overexpression : 2nd line with capecitabine 93,496 Bevacizumab Colorectal cancer : with irinotecan, fluorouracil, and leucovorin 98,937 Bevacizumab Colorectal cancer : with oxaliplatin, fluorouracil, and folinic acid 110,967 Dasatinib Chronic myeloid leukemia, chronic phase : 1st-line 118,050 Cetuximab Colorectal cancer : with irinotecan 121,528 Temsirolimus Renal cell carcinoma : 1st-line for poor prognosis patients 128,595 Bevacizumab Renal cell carcinoma : 1st line with interferon-α 131,070 Crizotinib NSCLC (ALK fusion positive) : 2nd line (vs. docetaxel) 158,133 Bevacizumab NSCLC : 1st line with platinum-based chemotherapy 196,000† Cetuximab Head and neck cancer (squamous cell carcinoma) : 1st line with platinum-based chemotherapy 261,767 Erlotinib Pancreatic cancer : 1st line with gemcitabine 430,000‡ ICER, Incremental Cost Effectiveness Ratio; NSCLC, non-small cell lung cancer * Most ICER values except two indications were retrieved from the National Institute for Health and Clinical Excellence in United Kingdom (costs are expressed in US dollars; £1 equals $1.574 (as of January 29, 2013)) † This value was from the Pharmaceutical Benefits Advisory Committee in Australia. (Canadian $1 equals US $0.98) http://www.health.gov.au/internet/main/publishing.nsf/Content/pbac-psd-bevacizumab-march11 ‡ This value was from Miksad RA et al. J Clin Oncol 25:4506-7; author reply 4508, 2007 Table 3. Reimbursement adequacy index and social health insurance system UK US Canada Australia Sweden France Japan Korea Taiwan Germany 0.79 0.79 0.68 0.63 0.58 0.58 0.58 0.53 0.53 0.47 33% General tax + 43% National insurance + Levies + other social security Premium Premium Premium Premium Government agency N/A Reimbursement adequacy index 76% General tax 42.9% General 98.5% 100% 100% Financing system + 18% National Tax General tax insurance + 3% General tax General tax (Medicare=TAX) +1.5% Levy user charge Health technology assessment (HTA) Government agency N/A Government Government Government independent independent agency Government Government Government agency agency independent 1999 N/A 1990 1954 1987 2004 N/A 2009 2007 2004 National Healthcare Service Consumer Sovereignty Model Social Health Insurance Social Health Insurance National Healthcare Service Social Health Insurance Social Health Insurance Social Health Insurance Social Health Insurance Social Health Insurance Date of HTA foundation Form of Health Security N/A, not available Table 4. Health expenditure of each country UK US 34397 45236 37773 Total expenditure on health (TEH), % of GDP (2009) 9.8 17.7 Public expenditure on health, % of TEH (2009) 83.4 Out-of-pocket expenditure (households) on health, % GDP per capita in US$ (2009) Canada Australia Sweden France Japan Korea Taiwan Germany 39833 37255 33785 32061 26881 32214* 35643 11.4 9.1 9.9 11.7 9.5 6.9 6.4* 11.7 47.3 70.9 68.5 81.5 76.9 80.5 58.2 26.6* 76.9 9.1 12 14.2 18.6 16.4 7.4 16 32.4 38.1* 13 11.8* 12.2 17 14.7 12.7 16.1 20.8 22.5 25* 14.9 80.4 78.5 80.8* 81.6 81.4 81.1 83 80.4 79* 80.3 of TEH (2009) Pharmaceutical expenditure and other medical nondurables, % of TEH (2009) Life expectancy of both sexes at birth in years (2009) Abbreviation: GDP, gross domestic product; UK, United Kingdom; US. United States Source: OECD website (except Taiwan) from http://www.oecd.org/els/health-systems/oecdhealthdata2012-frequentlyrequesteddata.htm For Taiwan, refers to 文羽苹 外, 台灣醫療保健支出成長率的分析:醫療通膨,質量與公平性, 台灣衛誌 2012, Vol.3 , No1 * When the data for 2009 was not available, the relevant data from 2008 was used.
