Scheme of Work
advertisement
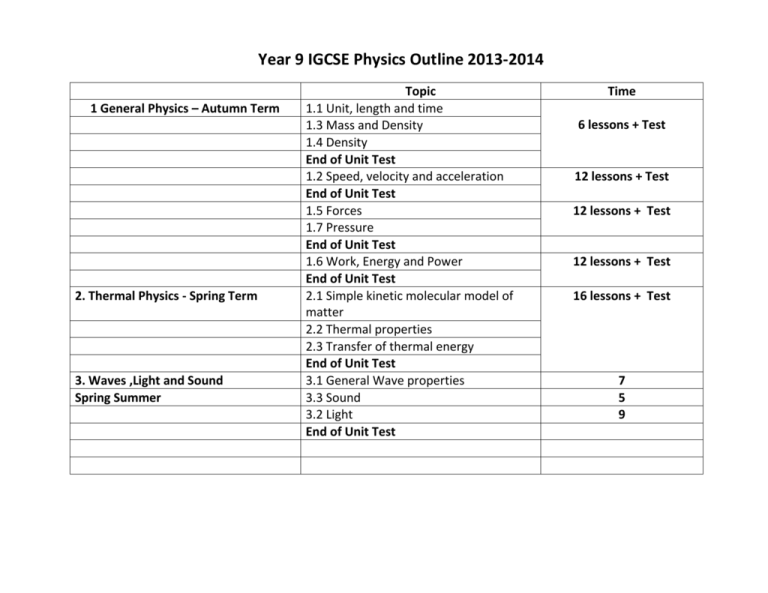
Year 9 IGCSE Physics Outline 2013-2014 1 General Physics – Autumn Term 2. Thermal Physics - Spring Term 3. Waves ,Light and Sound Spring Summer Topic 1.1 Unit, length and time 1.3 Mass and Density 1.4 Density End of Unit Test 1.2 Speed, velocity and acceleration End of Unit Test 1.5 Forces 1.7 Pressure End of Unit Test 1.6 Work, Energy and Power End of Unit Test 2.1 Simple kinetic molecular model of matter 2.2 Thermal properties 2.3 Transfer of thermal energy End of Unit Test 3.1 General Wave properties 3.3 Sound 3.2 Light End of Unit Test Time 6 lessons + Test 12 lessons + Test 12 lessons + Test 12 lessons + Test 16 lessons + Test 7 5 9 Modern English School Year 9 IGCSE Physics 2013-14 Term 1 Unit and Measurement – 6 lessons + Test Time Frame Topic 1 Lesson Practical Skills 3 lessons Cur ref. 1.1 1.4 objectives Activities Resources Introduce the students to IGCSE Physics and your expectations. The first lesson is to make sure that the students understand that scientists have agreed on SI units, prefixes and scientific notation. Hand out books, brainstorm and completing worksheets. Worksheets and PowerPoint’s available on the S-drive. Use and describe the use of rulers and measuring cylinders to determine a length or a volume. Use and describe the use of clocks and devices for measuring an interval of time. A circus of simple measuring experiments can work well here. Use and describe the use of a mechanical method for the measurement of a small distance measure and describe how to measure a short interval of time (including the period of a pendulum). It may be a good idea to tell the students the difference between analogue and digital display. You can tell the pupils about micrometers, but it would be better to wait until Year 10 to discuss zero error and how to read them with skill. Explain to the students to measure a cylinder like a test-tube it is easier to use to wooden blocks and a ruler to measure its diameter. Simple activities such as wrapping a length of thread 10 times round a boiling tube, measuring the length of thread and then calculating the circumference of the tube, working out the thickness of paper by the thickness of the stack and timing 20 swings of a pendulum to find the period. Stress the importance of reliable, precise and accurate results. Assessment 2 lessons Describe an experiment to determine the density of a liquid and of a regularly shaped solid and make the necessary calculation. Simple experiments measuring mass and volume of a liquid and calculating density. Using a solid, finding volume from height, width and depth. Describe the determination of the density of an irregularly shaped solid by the method of displacement and make the necessary calculation. Extend to the displacement method (e.g. plasticine of different shapes in a measuring cylinder with water). You have now done enough physics to introduce Paper 6 questions to the students. This can either be done as part of a lesson or as a homework. Remember that the students will have the past paper books at home which will contain the answers as well. Stress the importance of reliable, precise and accurate results. This is a good opportunity to do some investigative work. This would be a good planning opportunity. End of unit test 1.2 Speed, Velocity and acceleration Time Frame Topic Cur ref 2 lessons Mass /Weight 1.3 objectives Activities Resources Show familiarity with the idea of the mass of a Body. State that weight is a force. Demonstrate understanding that weights (and hence masses) may be compared using a balance. It is useful to ensure that students have a feeling for the sizes of forces (in N) by asking them to estimate (e.g. weight of a laboratory stool, force required to open a drawer) and then to measure using a spring (Newton) balance. Similarly, estimation and measurement of masses (in g and kg). Use some ‘novelty’ demonstrations (e.g. pulling a sheet of paper from under a mass, without moving the mass) to show the idea of inertia. Work with trolleys using ticker tape or light gates to produce speed/time graphs for constant speed and constant acceleration. There is much on this site about gravity, particularly to stretch the more able students. http://www.curtin.edu. au/curtin/dept/physsci/gravity/index2.htm Demonstrate an understanding that mass is a property which ‘resists’ change in motion. Describe, and use the concept of, weight as the effect of a gravitational field on a mass. 6 lessons Speed and Acceleration 1.2 W = mg Define speed and calculate speed from total distance/ total time plot and interpret a speed/time graph recognise from the shape of a speed/time graph when a body is (a) at rest, (b) moving with constant speed, (c) moving with changing speed calculate the area under a speed/time graph to determine the distance travelled for motion with constant acceleration demonstrate some understanding that acceleration is related to changing speed This is a good opportunity to reinforce graph drawing skills. Although not specifically part of the syllabus work on thinking distance and braking distance of cars related to safety is useful and relevant here. Internet research project and PowerPoint presentations on road safety. State that the acceleration of free fall for a body near to the Earth is constant. Distinguish between speed and velocity Recognise linear motion for which the acceleration is constant and calculate the acceleration. Light gates and a data logger can be used to demonstrate free fall. Worksheets and PowerPoint’s available on the S-drive. Data loggers to be used with trolleys as a Demo and data used by students to produce graphs on Excel. Some good work on velocity and acceleration with animations for student use. http://www.fearofphysi cs.com/Xva/xva. Make your own space shuttle. http://school.discovery. com/lessonplans/ Click on Physical Science, then Forces and Motion PowerPoint presentations Boardworks Education Using Assessment 1 lesson F = ma 2 lessons Scalars and vectors 1 lesson Circular motion 1.5e Recognise motion for which the acceleration is not constant. PowerPoint (S-Drive) Describe qualitatively the motion of bodies falling in a uniform gravitational field with and without air resistance (including reference to terminal velocity). Video 36 Science in Focus ‘Forces and Motion’ Recap the idea of resultant forces. Introduce inertia. Define the Newton. The calculation F = ma Demonstrate an understanding of the difference between scalars and vectors and give common examples. Add vectors by graphical representation to determine a resultant. Determine graphically a resultant of two vectors. Centripetal force and the idea that velocity changes but not speed. Data loggers to be used with trolleys as a Demo and data used by students to produce graphs on Excel. Past paper questions on scale drawing Worksheets and PowerPoint’s available on the S-drive. Demonstration: The ball attached to the force meter. Worksheets and PowerPoint’s available on the S-drive. End of Unit Test 1.5 Effect of Forces Time Frame Topic Cur ref 2 lessons Effects of Forces 1.5a objectives Activities Go over the importance of balanced forces. State that a force may produce a change in size and shape of a body. Plot extension/load graphs and describe the associated experimental procedure. Describe the ways in which a force may change the motion of a body. Find the Hooke’s Law experiment. This is a good opportunity to reinforce graph drawing skills. resultant of two or more forces acting along the same line recall and use the expression F = kx Resources This site provides a biographical sketch of Isaac Newton, with links to other scientists relevant to this and other areas of the syllabus. http://www.treasuretroves.com/bios/Newto n.html Worksheets and PowerPoint’s available on the S-drive. 6 lessons Forces – Turning effects 1.5 (b) 1.5 (c) 1.5 (d) Describe the moment of a force as a measure of its turning effect and give everyday examples describe, qualitatively, the balancing of a beam about a pivot. Experiments involving balancing a rule on a pivot with a variety of different weights should be used here. Worksheets and PowerPoint’s available on the S-drive. Apply the idea of opposing moments to simple systems in equilibrium. State that, when there is no resultant force and no resultant turning effect, a system is in equilibrium Perform and describe an experiment to determine the position of the centre of mass of a plane lamina. Describe qualitatively the effect of the position of the centre of mass on the stability of simple objects Video on the network ‘Machines and Moments’ Centre of mass A variety of shapes of lamina should be used in experiments to find the centre of mass. Standard shapes (circle, square, etc.) can be used first and then ‘non-standard’ shapes for which the position of the centre of mass is not so obvious. Extension students can be challenged with a lamina that has its centre of mass in a space (e.g. hole in the lamina). Assessment 2 lessons 1-2 lesson Pressure Gas pressure and volume 1.7 Relate (without calculation) pressure to force and area, using appropriate examples • Describe the simple mercury barometer and its use in measuring atmospheric pressure • Relate (without calculation) the pressure beneath a liquid surface to depth and to density, using appropriate examples • Use and describe the use of a manometer • Recall and use the equation p = F/A • Recall and use the equation p = hρg Relate the change in volume of a gas to change in pressure applied to the gas at constant temperature. Use p1v1=p2v2 They should have already covered p1/T1=p2/T2 so should be able to use p1v1/T1=p2v2/T2 Understanding of the Kelvin scale and absolute zero. Calculate the pressure various objects exert Demonstrate the peeing can. Worksheets and PowerPoint’s available on the S-drive. Demonstrate a barometer/ manometer. If you have not already you can show the collapsing can using a vacuum pump or collapsing soft drink can using steam and cold water. A direct measuring Boyle’s Law apparatus can be used here. Useful graph plotting If you have not already you can show the collapsing can using a vacuum pump or collapsing soft drink can using steam and cold water. This is a good opportunity to reinforce graph drawing skills. Worksheets and PowerPoint’s available on the S-drive. Use of data loggers to record data from demos and students to use data in Excel to produce graphs. A good simulation on PHETT Physics on the network to get ideal results. End of Unit Test 1.6 Work , Energy and Power 1 lesson Types of energy and energy transfers 1.6a 1-2 lessons 3 lessons Kinetic and potential energy 1.6a These three lessons are to introduce energy. Demonstrate an understanding that an object may have energy due to its motion or its position, and that energy may be transferred and stored. Give examples of energy in different forms, including kinetic, gravitational, chemical, strain, nuclear, internal, electrical, light and sound. Give examples of the conversion of energy from one form to another and of its transfer from one place to another. Apply the principle of energy conservation to simple examples. Go over with the students that we generate electricity using fossil fuels. At that with these running out we require alternative sources of energy e.g. solar, wind, etc. Introduce the Sankey diagram to the students. A number of devices which convert energy from one form to another e.g. loudspeaker, steam engine, solarpowered motor, candle etc. can be used. A circus of simple experiments can be set up for students to identify the energy conversions. Use the terms kinetic and potential energy in context. Recall and use the expressions k.e.= 1/2mv2 and p.e. = mgh Some heavy maths here that some students find difficult. Worksheets and PowerPoint’s available on the S-drive. Some unusual and fun energy change experiments http://littleshop.physics.colos tate.edu/ click on ideas for teachers changes in energy Download .pdf document now Go over the very basic structure of a power station. Practice rearranging both equations. Investigation of the speed of a marble leaving a ramp (altering the height of the ramp) related to the horizontal distance travelled. GPE (at top) = KE (at bottom) Students can word process lab report. Worksheets and PowerPoint’s available on the S-drive. Good questions in Physics for You (SS14) PPTs available in Boardworks and Education using PowerPoint Video 23a ‘Science in Action’ is a good video on energy changes. 3 lessons Energy Resources 1.6b Describe how electricity or other useful forms of energy may be obtained from (i) chemical energy stored in fuel (ii) water, including the energy stored in waves, in tides and in water behind hydroelectric dams (iii) geothermal resources (iv) nuclear fission (v) heat and light from the Sun. Show an understanding that energy is released by nuclear fusion in the Sun Show a qualitative understanding of efficiency. Important discussions here to consolidate the students’ understanding of energy processes both in physical and environmental impact terms. A good opportunity for independent internet research and PowerPoint presentations here to provide students with a complete set of notes. A detailed idea of how electricity is generated in a power station. Worksheets and PowerPoint’s available on the S-drive. This site provides a useful investigation into alternative energy. http://ericir.syr.edu/ This site gives much interesting information about different types of power stations and includes a virtual tour of a power station. http://www.ergon.com.au/ Click on EnergyEd, EnergyEd An excellent site. www.alternativeenergy.com 3 lessons Work and power 1.6c 1.6d Relate, without calculation; work done to the magnitude of a force and distance moved. Recall and use work done = Fd = energy transformed. Describe energy changes in terms of work done. In this and the following sections it may be useful to calculate (although only required for the extension paper) personal work done and power. For example, by walking up steps, recording the student’s weight, the vertical height climbed and the time taken. Worksheets and PowerPoint’s available on the S-drive. Relate, without calculation, power to work done and time taken, using appropriate examples. Recall and use the equation P = E/t in simple systems. They also need an appreciation of efficiency. End of Unit Test Term 2 2 Thermal Physics Time Frame Topic 2 lesson Thermal Physics States of matter 2 lessons Cur ref objectives 2.1a State the distinguishing properties of solids, liquids and gases. 2.1b Describe qualitatively the molecular structure of solids, liquids and gases. Interpret the temperature of a gas in terms of the motion of its molecules. Describe qualitatively the pressure of a gas in terms of the motion of its molecules. Describe qualitatively the effect of a change of temperature on the pressure of a gas at constant volume. Show an understanding of the random motion of particles in a suspension as evidence for the kinetic molecular model of matter. Describe this motion (sometimes known as Brownian motion) in terms of random molecular bombardment. Evaporation 2.1c Describe evaporation in terms of the escape of more-energetic molecules from the surface of a liquid. Relate evaporation and the consequent cooling. Demonstrate an understanding of how temperature, surface area and draught over a surface influence evaporation. Activities Resources Use examples of phenomena that are explained by the particle theory to build up understanding e.g. diffusion in liquids, diffusion of gases (bromine in air – fume cupboard required), crystal structure etc. Students should observe Brownian motion e.g. using the ‘smoke cell’ experiment. Models should be used to illustrate as much as possible (e.g. crystal model). Worksheets and PowerPoint’s available on the S-drive. This needs to be set-up beforehand. Simple demo: Acetone (propanone) on the skin. An investigation into the factors affecting rate of evaporation. This is a good opportunity to do some investigative work. This would be a good planning opportunity. Mention how refrigerators use the cooling effect of evaporation. Assessment This site has a good JAVA Applet that shows diffusion. http://www.geocities.c om/piratord/browni/Di fus.html Brownian motion is well illustrated on this site. http://www.phys.virgin ia.edu/classes/109N/m ore_stu ff/Applets/ Click on Einstein's Explanation of Brownian Motion. Worksheets and PowerPoint’s available on the S-drive. Lab report 1 lesson Heating gases 2.1d Relate the change in temperature of a gas to change in pressure applied to the gas at constant volume. The use of p1/T1=p2/T2 Understanding of the Kelvin scale and absolute zero. 3 lessons Thermal expansion of solids, liquids and gases Measurement of Temperature 2.2(a) 2.2(b) Describe qualitatively the thermal expansion of solids, liquids and gases. Identify and explain some of the everyday applications and consequences of thermal expansion. Describe qualitatively the effect of a change of temperature on the volume of a gas at constant pressure. Show an appreciation of the relative order of magnitude of the expansion of solids, liquids and gases. Demonstrate understanding of sensitivity, range and linearity. Describe the structure of a thermocouple and show understanding of its use for measuring high temperatures and those which vary rapidly. You could demonstrate temperature and volume change using a round bottom flask (containing air) and a capillary tube (containing a small amount of coloured liquid). Warm the air and the coloured liquid will rise. Or you can turn it upside down, so the capillary tube is in the water and you can see bubbles in the water. This is a good opportunity to reinforce graph drawing skills. Worksheets and PowerPoint’s available on the S-drive. Experiments to show expansion of a metal rod and the ‘bar breaker’ demonstration. Bi-metallic strips. A large round bottom flask filled with (coloured) water and fitted with a long glass tube shows expansion of the water when heated gently. The ‘fountain’ experiment shows the expansion of air and brings in good discussion of the effect of pressure difference to stretch the more able students. Worksheets and PowerPoint’s available on the S-drive. The calibrating a thermometer using ice and steam as a class practical. A simple thermocouple can be constructed and used. Use of data loggers to record data from demos and students to use data in Excel to produce graphs. A good simulation on PHETT Physics on the network to get ideal results. Video 13a on network ‘Heat and Temperature’ 2 lessons Specific heat capacity 2.2c Describe an experiment to measure the specific heat capacity of a substance. Use the equation Q=mc∆T 2 lessons Melting/boilin g and latent heat 2.2d State the meaning of melting point and boiling point. Describe condensation and solidification. Distinguish between boiling and evaporation Use the term latent heat and give a molecular interpretation of latent heat. Describe an experiment to measure specific latent heats for steam and for ice. Use E=Lm This can be extended to a quantitative determination of specific heat capacity. A good practical is finding the specific heat capacities of different metal blocks using an electric heating element. The pupils will need voltmeters and ammeters to work out the power. They will also need a stopwatch so they can calculate the energy supplied. A good opportunity to analyse results. Heating and cooling curves can be plotted from experimental readings using data loggers. Stress the advantages of using them. This is a good opportunity to reinforce graph drawing skills. Experimental determination of latent heat of ice. This is a good opportunity to do some investigative work. This would be a good planning opportunity. The pupils will need voltmeters and ammeters to work out the power. They will also need a stopwatch so they can calculate the energy supplied. Worksheets and PowerPoint’s available on the S-drive. Worksheets and PowerPoint’s available on the S-drive. A good point to give practice in paper 3 question4 4 lessons Conduction, convection and radiation 2.3a 2.3b 2.3c 2.3d Describe experiments to demonstrate the properties of good and bad conductors of heat. Give a simple molecular account of the heat transfer in solids. Relate convection in fluids to density changes and describe experiments to illustrate convection. Identify infra-red radiation as part of the electromagnetic spectrum. Describe experiments to show good and bad emitters/absorbers of radiation. Identify and explain some of the everyday applications and consequences of conduction, convection and radiation. Simple experiments to compare thermal conductivity e.g. using metal conductivity rods, ice cube on metal/insulator. Thermometers wrapped in foil, black paper and white paper. Ice cube in the bottom of a boiling tube that doesn’t melt if heated from the top. Stress the importance of reliable, precise and accurate results. Students could evaluate all the different experiments. Potassium permanganate demo. Lesley’s cube Use data loggers. Stress the advantages of using them. A thermos flask is a good example here. How houses are insulated against heat loss Worksheets and PowerPoint’s available on the S-drive. Education using PowerPoint has some good animations and everyday examples. End of Unit test 3.3 Sound Time Frame Topic 3 lessons sound Cur ref 3.3 objectives Describe the production of sound by vibrating sources. Describe the longitudinal nature of sound waves. State the approximate range of audible frequencies. Show an understanding that a medium is required in order to transmit sound waves. Describe an experiment to determine the speed of sound in air. Relate the loudness and pitch of sound waves to amplitude and frequency. Describe compression and rarefaction 1-2 lesson Uses of sound Basic idea of resonance Describe how the reflection of sound may produce an echo. – Sonar Ultrasound Activities Resources Use a variety of musical instruments to introduce this section. A signal generator and loudspeaker can be used to investigate the range of audible frequencies. A bell in a bell jar that can be evacuated can be used to show that a medium is required for the transmission of sound (at the same time showing that light travels through a vacuum). Use of a C.R.O. and microphone gives a visual picture of amplitude and frequency. Extension candidates can analyse the C.R.O. traces in more detail. Worksheets and PowerPoint’s available on the S-drive. You could take the students outside to measure the speed of sound using an echo. Worksheets and PowerPoint’s available on the S-drive. This site contains much interesting work on resonance including a video of the Tacoma Narrows Bridge disaster. http://www.enm.bris.ac.uk/ This site about sound waves is informative and includes audio! http://library.thinkquest.or g/26585/index.html Assessment 3.1 Wave properties Time Frame Topic Cur ref 6 lessons Reflection, Refraction, 3.2a Total Internal Reflection 3.2b objectives Activities Resources Describe the formation, and give the characteristics, of an optical image by a plane mirror. Use the law angle of incidence = angle of reflection. Use simple experiments with optical pins to find the position of the image in a plane mirror. Use ray box experiments to investigate angle of incidence = angle of reflection. Worksheets and PowerPoint’s available on the S-drive. Describe an experimental demonstration of the refraction of light. Use the terminology for the angle of incidence i and angle of refraction r and describe the passage of light through parallel-sided transparent material give the meaning of critical angle. Describe internal and total internal reflection. Recall and use definition of refractive index n in terms of speed. Recall and use the equation sin i/sin r = n. Describe the action of optical fibres. Use rectangular transparent blocks (Perspex or glass) with optical pins or ray boxes to investigate refraction. Develop this to experiments with a semicircular transparent block to investigate critical angle and total internal reflection. Internet research to produce own notes on uses of fibre optics: communication and medical Extend the refraction work with the rectangular block to include quantitative use of sin i/sin r. Encourage deeper thought with able candidates by discussing refractive index in terms of the speed of light in different materials. Use inexpensive ‘novelty’ light items to demonstrate optical fibres. Instructions for a demonstration of total internal reflection http://www.learn.co.uk /learnthings click on enter, then KS4 science foundation, then light and colour, then total internal reflection. More details on further experiments related to total internal reflection and much more http://www.phys.virgin ia.edu/Education/outre ach click on 8thgrade Physical Science Sol Activities then PS.9 to find total internal reflection PPTs available on network Boardworks Video 25a has several good 20min videos on Light/Colour/Reflection /and Refraction Assessment Consolidation exercises from Physics Matters 1 lesson Colour 3.2 (d) Give a qualitative account of the dispersion of light as illustrated by the action on light of a glass prism. Use a simple experiment, or demonstration, to show that white light from a ray box or slide projector is dispersed by a prism. A single slit can be cut from a piece of stiff card and inserted in the slide carrier of the projector to produce a ray that can be shone through the prism on to a screen. Although not part of the syllabus, students will find it interesting to learn a little about mixing coloured lights at this stage. Worksheets and PowerPoint’s available on the S-drive. Interactive colour mixing (no need for a colour mixing kit or blackout) http://www.phy.ntnu.e du.tw/java/shadow/sha dow.html Term 3 3.2 Light Time Frame Topic Cur ref 4 lessons lenses 3.2c objectives Activities Resources Describe the action of a thin converging lens on a beam of light. Use the terms principal focus and focal length. Draw ray diagrams to illustrate the formation of a real image by a single lens. Investigate converging lenses by: forming an image of a distant object (e.g. a tree or building seen from the laboratory window), bringing parallel rays from a ray box to a focus through a cylindrical lens, drawing ray diagrams to scale to show the formation of a real image. Worksheets and PowerPoint’s available on the S-drive. Draw ray diagrams to illustrate the formation of a virtual image by a single lens. Use and describe the use of a single lens as a magnifying glass. Extend the ray diagram work to include the formation of a virtual image and use a magnifying glass. 2 lessons 3 lessons Wave equation EM spectrum Give the meaning of the term wave front. Recall and use the equation v = f x. Interpret reflection, refraction and diffraction using wave theory. This is a good opportunity to do some investigative work. This would be an evaluation opportunity. The students could look at paper 6 questions and try the lens experiments on them, so they can evaluate them. Use a set of ripple tank projection slides to reinforce the ripple tank work and focus on more detailed discussion Describe the main features of the electromagnetic spectrum and state that all e-m waves travel with the same high speed in vacuum. Include plenty of examples to show students that they already have much general knowledge regarding the uses of electromagnetic waves Use the term monochromatic Assessment There is a large amount of information and teaching on this site http://www.physicsclas sroom.com/Class/refrn/ U14L5a. html Boardworks PPT shows this clearly Worksheets and PowerPoint’s available on the S-drive. http://www.colorado.e du/physics/2000/index. pl opportunity for research project and students to present ‘uses and dangers’ of EM waves in ppt to form class notes End of Unit test or End of year exam 1-2 lessons Revision for end of Year 9 Exam 1-4 lessons Start Radioactivity General revision to remind Year 9 what has been covered this year. Personal revision, revision tests, making revision notes, open book tests, revision posters and class discussion. Worksheets and PowerPoint’s available on the S-drive. You should have enough time to recap/introduce the structure of the Atom. Alpha, Beta and Gamma. See Year 10 Scheme of work. Worksheets and PowerPoint’s available on the S-drive. End of year exam
