nph12454-sup-0001-FigS1-S4-TableS1-S3
advertisement
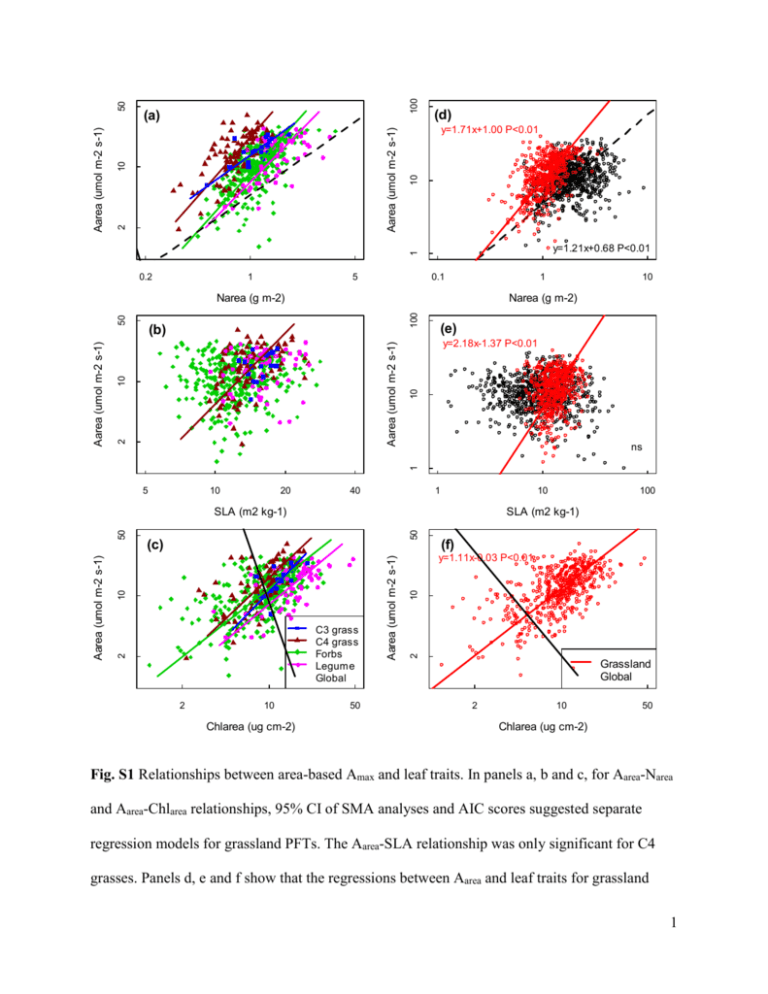
100 (d) y=1.71x+1.00 P<0.01 10 Aarea (umol m-2 s-1) 50 10 y=1.21x+0.68 P<0.01 1 2 Aarea (umol m-2 s-1) (a) 0.2 1 5 0.1 1 100 Narea (g m-2) (e) y=2.18x-1.37 P<0.01 10 10 Aarea (umol m-2 s-1) (b) ns 1 2 Aarea (umol m-2 s-1) 50 Narea (g m-2) 10 5 10 20 40 1 10 50 SLA (m2 kg-1) 2 10 Chlarea (ug cm-2) 50 (f) 10 y=1.11x-0.03 P<0.01 2 C3 grass C4 grass Forbs Legume Global Aarea (umol m-2 s-1) 10 (c) 2 Aarea (umol m-2 s-1) 50 SLA (m2 kg-1) 100 Grassland Global 2 10 50 Chlarea (ug cm-2) Fig. S1 Relationships between area-based Amax and leaf traits. In panels a, b and c, for Aarea-Narea and Aarea-Chlarea relationships, 95% CI of SMA analyses and AIC scores suggested separate regression models for grassland PFTs. The Aarea-SLA relationship was only significant for C4 grasses. Panels d, e and f show that the regressions between Aarea and leaf traits for grassland 1 species were different from global average. Lines were drawn for significant relationships. The global relationship between Aarea and SLA was not significant. 2 1000 0.1 2 1 y=1.33x+0.68 R 10 1 10 100 1 Narea (g m-2) 0.5 100 2 0.13 10 (d) Glopnet grass data Glopnet 10 ns ns 1 0.09 Aarea (umol m-2 s-1) 100 0.1 2 SLA (m2 kg-1) 10 2 y=1.21x+0.68 R 1 Aarea (umol m-2 s-1) (c) 0.46 0.53 Nmass (%) y=1.68x+0.77 R 2 100 1000 y=1.72x+1.57R (b) y=1.74x+0.13 R 10 Amass (nmol g-1 s-1) 0.52 100 2 10 Amass(nmol g-1 s-1) (a) y=2.17x+1.47R 1 10 100 SLA (m2 kg-1) Fig. S2 Comparison of Amax-leaf traits relationships between Glopnet herbaceous data and the global average. The grey dots indicate Glopnet dataset. Red dots indicate herbaceous plant subset of Glopnet. Regression lines were drawn for significant SMA regressions. 3 25 25 20 15 10 5 0 5 10 15 An (umol m-2 s-1) 20 (b) Jul 0 An (umol m-2 s-1) (a) Jun 0 100 200 300 400 500 600 700 0 100 400 500 600 700 25 15 10 mean 95% CI 95% PI 0 5 An (umol m-2 s-1) 15 10 5 0 20 (d) Sep 20 (c) Aug An (umol m-2 s-1) 300 Intercellular CO2 (ppm) 25 Intercellular CO2 (ppm) 200 0 100 200 300 400 500 Intercellular CO2 (ppm) 600 700 0 100 200 300 400 500 600 700 Intercellular CO2 (ppm) Fig. S3 Photosynthetic responses to CO2. Black dots indicate observed values. 95% CI means 95% confidence interval. 95% PI means 95% predictive interval. CO2 response was dependent on both plant species and month in which the measurements were taken. CO2 responses of Andropogon gerardii through the growing season are shown in the figure. Each panel shows one A/Ci curve in each month from June to September. Initial slope of A/Ci curve and maximum photosynthesis rate at saturating CO2 decreased in late growing season. 4 250 200 150 100 50 Jmax (umol m-2 s-1) _ || | _ _|_ ___ 40 || | |_ | _| | 60 __ _ |_ _ _ _ | __| | _| _| __ | | _ |_ _ |_ _| _ | | |__ _ _ | || | __ _| | |__| | _ _ _| _ __ | _| | | | | | | C3 grass Forb Legume 80 100 120 140 Vcmax (umol m-2 s-1) Fig. S4 Positive regression between Jmax and Vcmax (Jmax=1.504Vcmax-4.023). 5 Relationships Amass-Nmass Amass-SLA Amass-Chlmass Aarea-Narea Aarea-SLA Aarea-Chlarea Data set C3 grass C4 grass Forb Legume Grassland Global Combined C3 grass C4 grass Forb Legume Grassland Global Combined C3 grass C4 grass Forb Legume Grassland Global Combined C3 grass C4 grass Forb Legume Grassland Global Combined C3 grass C4 grass Forb Legume Grassland Global Combined C3 grass C4 grass Forb Legume Grassland Global Combined Slope Intercept Mean 95% CI Mean 95% CI 1.35 1.01 1.81 2.07 1.96 2.17 1.91 1.67 2.18 2.19 2.15 2.24 2.00 1.88 2.13 1.83 1.81 1.86 2.46 2.07 2.92 1.41 1.24 1.58 1.81 1.70 1.92 1.90 1.87 1.92 1.72 1.63 1.81 1.57 1.54 1.59 1.76 1.68 1.84 1.70 1.68 1.73 3.57 2.37 5.38 -1.89 -3.69 -0.09 3.52 2.97 4.18 -1.77 -2.46 -1.07 2.52 2.30 2.77 -0.65 -0.90 -0.39 2.71 2.14 3.42 -0.93 -1.70 -0.15 2.65 2.47 2.85 -0.79 -1.01 -0.58 1.33 1.26 1.40 0.68 0.61 0.74 1.55 1.49 1.62 0.45 0.38 0.52 1.37 0.98 1.93 1.98 1.83 2.14 1.41 1.23 1.62 2.14 2.09 2.20 1.14 1.06 1.23 2.07 2.05 2.10 1.37 1.13 1.65 1.81 1.69 1.93 1.15 1.08 1.22 2.07 2.05 2.09 na na 1.25 0.89 1.75 1.14 1.08 1.20 1.96 1.67 2.29 1.34 1.29 1.40 1.95 1.81 2.11 0.93 0.91 0.95 1.76 1.40 2.21 0.83 0.74 0.92 1.72 1.60 1.85 1.00 0.98 1.02 1.21 1.13 1.30 0.68 0.65 0.71 1.16 1.10 1.22 0.83 0.81 0.85 ns 2.73 2.24 3.33 -1.99 -2.62 -1.36 ns ns 2.17 2.00 2.37 -1.37 -1.58 -1.16 ns ns 1.49 1.00 2.21 -0.44 -1.10 0.22 1.35 1.15 1.58 -0.14 -0.35 0.07 1.13 1.04 1.22 -0.04 -0.13 0.05 1.18 0.97 1.44 -0.28 -0.57 0.01 1.11 1.04 1.19 -0.03 -0.11 0.05 na na R2 P-value 0.69 0.62 0.63 0.60 0.50 0.53 0.38 0.37 0.38 0.21 0.25 0.29 0.50 0.45 0.57 0.59 0.47 0.50 0.51 <0.01 <0.01 <0.01 <0.01 <0.01 <0.01 <0.01 <0.01 <0.01 <0.01 <0.01 <0.01 <0.01 <0.01 <0.01 <0.01 <0.01 <0.01 <0.01 0.57 0.47 0.45 0.30 0.29 0.13 0.08 0.15 0.15 0.01 0.02 0.04 0.00 0.00 0.41 0.45 0.35 0.38 0.36 <0.01 <0.01 <0.01 <0.01 <0.01 <0.01 <0.01 0.12 <0.01 0.10 0.27 <0.01 0.15 0.11 <0.01 <0.01 <0.01 <0.01 <0.01 Sample AIC size 18 -25.07 86 -10.07 363 -162.53 56 -24.64 523 -3.88 712 68.85 1235 554.88 18 -9.93 86 40.85 363 189.37 56 19.86 523 243.34 764 109.47 1287 363.91 18 -18.27 86 -2.34 362 -6.00 56 -10.37 522 -9.88 18 85 361 56 520 723 1243 18 85 361 56 520 764 1284 18 85 365 64 532 -23.91 -19.95 -107.23 -0.78 33.99 139.57 476.17 -7.20 36.53 263.02 34.77 321.70 472.85 905.21 -17.10 -15.59 -28.44 -16.60 -46.46 6 Table S1 Standardized major axis slopes and intercepts with 95% confidence intervals, coefficients of determination (R2), P-value, sample size and AIC scores for grassland PFTs, Glopnet and combined grassland and Glopnet data. “na”, not applicable: in these cases the global relationships were not available. “ns”, not significant: in these cases the correlations were not significant. While standardized major axis can still be fitted in such cases, the slopes are essentially meaningless. All other relationships were highly significant. 7 N 1 2 3 4 5 6 7 8 9 10 11 12 13 14 15 16 17 18 19 20 21 22 23 24 25 Amass-Nmass Species Intercept Slope Mean 95% CI Mean 95% CI na C. bicknellii 1.35 1.01 1.81 2.07 1.96 2.17 E. canadensis 2.14 1.74 2.63 2.13 2.05 2.21 A. gerardii na S. scoparium 1.87 1.56 2.24 2.23 2.16 2.30 S. nutans A. novae-angliae 2.91 2.32 3.65 1.57 1.42 1.72 1.73 1.50 2.00 1.89 1.84 1.94 C. tripteris 2.28 1.55 3.35 1.92 1.79 2.04 E. pallida H. grosseserratus 2.14 1.69 2.72 1.78 1.63 1.92 H. helianthoides 2.40 1.97 2.93 1.73 1.63 1.83 2.37 1.86 3.01 1.70 1.57 1.84 M. fistulosa 1.74 1.09 2.78 2.06 1.96 2.15 P. integrifolium 2.03 1.47 2.80 1.94 1.84 2.05 P. digitalis na P. virginianum 1.91 1.67 2.19 1.85 1.79 1.90 R. pinnata 1.78 1.50 2.10 1.86 1.80 1.92 R. subtomentosa 1.83 1.47 2.28 1.82 1.74 1.91 S. integrifolium ns S. laciniatum 2.45 1.85 3.24 1.65 1.50 1.80 S. perfoliatum ns S. terebinthinaceum 1.99 1.57 2.52 1.88 1.80 1.96 S. rigida 2.93 2.18 3.93 0.95 0.53 1.36 B. leucantha na D. purpureum 2.77 2.36 3.26 1.36 1.19 1.53 D. canadense 3.31 2.43 4.49 1.32 1.03 1.61 L. capitata Amass-Chlmass Amass-SLA Intercept Slope Intercept Slope Mean 95% CI Mean 95% CI Mean 95% CI Mean 95% CI na na 3.57 2.37 5.38 -1.89 -3.69 -0.09 1.37 0.98 1.93 1.98 1.83 2.14 3.19 2.46 4.15 -1.46 -2.47 -0.46 1.42 1.11 1.82 2.15 2.06 2.25 na na 4.32 3.43 5.44 -2.58 -3.70 -1.46 1.39 1.18 1.65 2.13 2.07 2.20 3.33 2.08 5.34 -1.86 -3.83 0.10 2.00 1.42 2.82 1.76 1.58 1.95 3.17 2.31 4.35 -1.29 -2.38 -0.20 0.75 0.60 0.94 2.22 2.15 2.28 ns ns 1.21 0.90 1.62 2.16 2.07 2.26 ns 4.69 3.41 6.43 -3.45 -5.25 -1.66 1.39 1.12 1.73 2.00 1.92 2.08 2.51 1.97 3.21 -0.93 -1.70 -0.15 1.26 0.98 1.62 2.04 1.96 2.11 1.23 0.80 1.89 2.02 1.93 2.11 ns 1.10 0.78 1.54 2.02 1.90 2.14 ns na na 2.61 2.14 3.19 -0.75 -1.34 -0.15 1.32 1.02 1.72 2.03 1.95 2.11 2.93 2.26 3.79 -1.23 -2.08 -0.37 1.18 0.93 1.50 2.07 1.99 2.15 2.79 2.11 3.70 -0.81 -1.61 0.00 1.20 0.94 1.53 2.01 1.93 2.09 ns ns 4.16 3.04 5.68 -2.39 -3.79 -1.00 1.25 0.94 1.67 2.15 2.03 2.28 ns ns 2.87 2.17 3.78 -0.90 -1.74 -0.05 1.15 0.90 1.46 1.95 1.87 2.03 1.47 1.03 2.10 1.65 1.40 1.91 ns na na 3.46 2.56 4.68 -1.96 -3.30 -0.63 1.25 0.95 1.63 1.89 1.74 2.05 2.15 1.71 2.71 1.66 1.52 1.81 ns 8 N 1 2 3 4 5 6 7 8 9 10 11 12 13 14 15 16 17 18 19 20 21 22 23 24 25 Aarea-Narea Slope Intercept Mean 95% CI Mean 95% CI C. bicknellii na E. canadensis 1.25 0.89 1.75 1.14 1.08 1.20 A. gerardii 2.05 1.56 2.69 1.33 1.24 1.43 S. scoparium na S. nutans 1.89 1.57 2.29 1.35 1.29 1.42 A. novae-angliae 2.80 1.88 4.17 0.95 0.81 1.10 C. tripteris 1.76 1.48 2.10 0.94 0.89 0.98 E. pallida 1.96 1.17 3.28 0.96 0.82 1.11 H. grosseserratus 1.91 1.46 2.49 0.92 0.81 1.03 H. helianthoides 1.80 1.47 2.21 1.01 0.97 1.06 M. fistulosa ns P. integrifolium 1.43 0.81 2.53 1.10 0.97 1.23 P. digitalis 1.97 1.28 3.03 0.98 0.83 1.13 P. virginianum na R. pinnata 2.22 1.75 2.81 0.94 0.89 1.00 R. subtomentosa 2.27 1.79 2.88 0.96 0.90 1.02 S. integrifolium 1.96 1.48 2.61 0.81 0.72 0.91 S. laciniatum 3.03 1.79 5.12 0.59 0.19 0.98 S. perfoliatum 2.67 1.92 3.71 0.71 0.57 0.86 S. terebinthinaceum ns S. rigida 2.03 1.46 2.81 0.92 0.83 1.01 B. leucantha 1.66 1.05 2.64 0.64 0.36 0.91 D. purpureum na D. canadense 2.33 1.78 3.05 0.86 0.76 0.96 L. capitata 3.42 1.85 6.31 0.54 0.12 0.96 Species Aarea-SLA Aarea-Chlarea Slope Intercept Slope Intercept Mean 95% CI Mean 95% CI Mean 95% CI Mean 95% CI na ns ns 1.49 1.00 2.21 -0.44 -1.10 0.22 2.69 1.97 3.66 -2.05 -3.06 -1.04 1.43 1.07 1.90 -0.19 -0.59 0.20 na 2.27 1.35 3.80 -1.61 -2.96 -0.26 3.2 2.47 4.15 -2.42 -3.36 -1.48 1.30 1.08 1.57 -0.11 -0.35 0.13 ns 2.57 1.74 3.78 -1.60 -2.61 -0.59 ns 0.76 0.59 0.97 0.44 0.28 0.60 ns ns ns 1.27 0.94 1.73 -0.09 -0.51 0.32 ns 1.04 0.81 1.32 0.03 -0.21 0.27 1.82 1.30 2.54 -1.30 -2.08 -0.53 1.14 0.82 1.58 -0.05 -0.39 0.29 ns 1.22 0.75 2.00 -0.18 -0.78 0.42 ns 1.06 0.73 1.53 -0.04 -0.38 0.30 na 1.22 0.92 1.63 -0.51 -0.88 -0.15 1.93 1.47 2.52 -1.10 -1.70 -0.51 ns 2.27 1.63 3.16 -1.61 -2.47 -0.76 1.24 0.92 1.67 -0.14 -0.48 0.19 ns 1.19 0.89 1.58 -0.18 -0.53 0.17 ns ns ns 1.37 1.00 1.89 -0.19 -0.57 0.20 ns ns 2.28 1.61 3.22 -1.33 -2.18 -0.48 1.07 0.80 1.43 -0.11 -0.45 0.24 ns 1.46 1.00 2.15 -0.74 -1.49 0.02 na 0.73 0.41 1.28 0.20 -0.39 0.79 ns 1.24 0.92 1.66 -0.28 -0.71 0.15 ns 2.27 1.53 3.36 -1.50 -2.56 -0.45 9 Table S2 Within-species Amax-trait relationships. In both mass-based and area-based relationships, Amax was positively correlated with leaf N and Chl for most species. Many species showed non-significant relationships between Amax and SLA. “na”, not applicable: in these cases SLA data were not collected. “ns”, not significant: in these cases the relationships between Amax and leaf traits were not significant. 10 N 1 2 3 4 5 6 7 8 9 10 11 12 13 14 15 16 17 18 19 20 21 22 23 24 25 PFT Species C3 grass C. bicknellii C3 grass E. canadensis C4 grass A. gerardii C4 grass S. scoparium C4 grass S. nutans Forb A. novae-angliae Forb C. tripteris Forb E. pallida Forb H. grosseserratus Forb H. helianthoides Forb M. fistulosa Forb P. integrifolium Forb P. digitalis Forb P. virginianum Forb R. pinnata Forb R. subtomentosa Forb S. integrifolium Forb S. laciniatum Forb S. perfoliatum Forb S. terebinthinaceum Forb S. rigida Legume B. leucantha Legume D. purpurea Legume D. canadense Legume L. capitata τ(Chl τ(SLA Proportion of Proportion τ(αleaf) τ(N τ(υleaf) fixed effects on effect) effect) of fixed effect) ×103 3 Vcmax and Vmax ×103 effects on α ×10 ns 4.68 5.33 2.50 5.90 6.67 4.80 6.24 6.19 4.60 4.11 4.50 3.89 ns 3.49 4.51 4.03 1.94 5.14 ns 3.15 6.40 3.48 6.62 8.20 5.03 4.61 2.56 1.68 2.32 5.23 2.76 2.57 6.75 2.65 2.04 3.02 3.27 6.31 3.52 2.16 3.82 7.61 4.06 8.59 4.57 2.76 6.97 4.55 2.78 ns 0.50 0.68 0.60 0.72 0.56 0.63 0.71 0.48 0.63 0.67 0.60 0.54 ns 0.50 0.68 0.51 0.20 0.56 ns 0.41 0.70 0.33 0.59 0.75 ns 15.13 6.30 6.56 9.97 20.59 14.39 ns 26.24 14.99 9.98 20.47 12.83 16.68 6.79 7.51 16.34 ns 12.97 ns 10.33 17.94 17.59 18.63 18.41 na ns ns na ns ns ns ns ns ns 10.67 ns ns na 13.87 12.57 ns ns ns ns 7.25 ns na ns ns 12.80 12.03 19.56 6.53 11.36 7.82 8.10 18.03 10.37 11.69 9.44 8.70 15.63 7.27 12.52 13.33 17.30 19.23 14.99 17.50 6.99 7.75 7.14 10.52 12.73 ns 0.56 0.24 0.50 0.47 0.72 0.64 ns 0.72 0.56 0.69 0.70 0.45 0.70 0.62 0.60 0.49 ns 0.46 ns 0.72 0.70 0.71 0.64 0.59 τ 0.93 0.47 0.42 0.32 0.50 1.10 1.21 0.28 1.00 0.97 0.90 1.05 0.83 1.00 0.83 1.70 1.58 0.61 0.32 0.41 0.85 1.03 0.55 1.05 1.30 11 N 1 2 3 4 5 6 7 8 9 10 11 12 13 14 15 16 17 18 19 20 21 22 23 24 25 Species Mean C. bicknellii 4.73 E. canadensis 9.85 A. gerardii 11.76 S. scoparium 10.44 S. nutans 12.47 A. novae-angliae 14.57 C. tripteris 10.53 E. pallida 18.95 H. grosseserratus 10.95 H. helianthoides 8.21 M. fistulosa 11.14 P. integrifolium 13.13 P. digitalis 11.51 P. virginianum 4.67 R. pinnata 6.93 R. subtomentosa 7.89 S. integrifolium 6.32 S. laciniatum 3.14 S. perfoliatum 7.62 S. terebinthinaceum 12.52 S. rigida 7.89 B. leucantha 12.89 D. purpurea 7.22 D. canadense 12.48 L. capitata 17.72 βN 95% CI -2.27 10.02 7.07 12.03 8.71 14.94 4.02 15.42 9.32 15.57 13.33 16.08 7.85 12.52 17.67 20.63 8.19 13.65 5.61 10.96 8.95 14.18 10.75 15.73 10.24 12.96 -3.33 9.97 4.70 9.49 5.31 10.35 2.81 9.54 1.19 5.15 4.81 10.39 -14.70 38.72 4.90 11.20 11.30 14.29 5.71 9.10 11.03 14.11 15.24 19.78 N 0.88 1.78 1.29 1.08 1.08 1.62 1.35 1.24 1.69 1.50 1.66 0.99 0.95 1.19 1.58 1.36 1.31 1.29 1.44 1.26 1.34 2.97 2.71 2.33 1.88 Mean 1.34 4.87 1.54 1.62 2.55 8.23 3.53 1.00 5.49 4.21 3.84 5.70 3.41 2.32 2.13 2.17 3.20 3.18 3.20 1.68 2.03 2.94 1.29 3.52 4.19 βChl×103 95% CI -2.71 5.07 3.91 5.87 1.04 1.99 1.41 1.84 1.95 3.11 7.21 9.40 2.88 4.23 -9.24 10.33 4.53 6.43 3.28 5.09 3.36 4.32 4.90 6.56 2.60 4.22 1.79 2.84 1.62 2.82 1.22 3.02 2.54 4.09 -2.41 8.72 2.50 3.97 -7.50 10.30 1.35 2.93 2.34 3.58 0.79 1.69 2.94 4.43 2.70 5.74 Chl 10.74 12.72 9.31 12.29 9.81 10.02 7.24 11.72 10.58 8.56 8.10 8.53 7.34 10.02 10.28 7.90 10.33 11.62 6.97 13.57 13.13 21.04 25.04 14.44 14.56 Mean 5.66 3.53 0.88 1.16 1.68 0.57 3.04 1.09 2.56 -1.30 3.15 4.60 3.51 3.48 -2.10 5.92 -1.05 3.04 -0.94 4.21 9.83 βSLA×103 95% CI na -5.59 19.87 -17.56 22.19 na -0.93 2.89 -3.13 6.06 -3.91 6.75 -4.13 5.74 -1.96 7.35 -0.87 3.05 1.95 3.71 -18.94 18.97 -36.85 41.24 na 3.88 5.31 2.98 4.08 -6.32 14.80 -16.74 15.40 -5.66 17.49 -10.85 8.50 2.27 3.80 -10.73 7.65 na -3.44 10.51 -4.84 21.96 SLA 15.81 15.79 13.12 16.39 11.76 10.47 12.39 15.70 17.85 12.63 11.23 13.68 13.42 10.33 7.91 11.55 10.64 11.31 14.41 18.10 12.76 Table S3 Variability of Vcmax, Vmax and quantum efficiency contributed by fixed and random effects. τ(N effect): standard deviation of fixed leaf N effect on Vcmax or Vmax (N effect=βN×(N- N )). τ(υleaf): standard deviation of random individual leaf effect on Vcmax or Vmax (υleaf). Proportion of fixed effects on Vcmax or Vmax: proportion of variability in Vcmax or Vmax contributed by fixed effect. τ(Chl effect): standard deviation of fixed chlorophyll effect on quantum efficiency (Chl effect=βChl×(Chl- Chl )). τ(SLA effect): standard deviation of fixed chlorophyll effect on quantum efficiency (SLA effect=βSLA×(SLA- SLA )). 12 τ(αleaf): standard deviation of random individual leaf effect on quantum efficiency (αleaf). Proportion of fixed effects on α: proportion of variability in quantum efficiency contributed by fixed effect. τ: model residual error. “na”, not applicable: in these cases SLA data were not collected for the given species. “ns”, not significant: in these cases the fixed effects of leaf traits on photosynthetic parameters were not significant. 13
