Using the Scientific Method Lab
advertisement
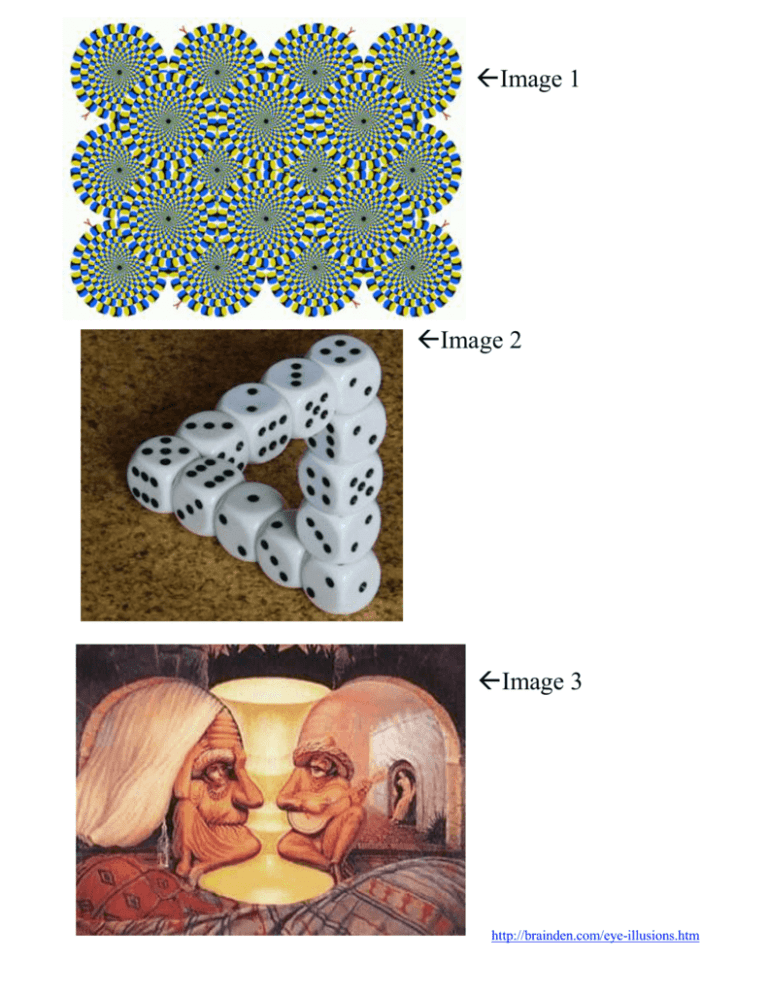
Image 1 Image 2 Image 3 http://brainden.com/eye-illusions.htm Name: ______________________________________________________ Date: 9/3/13 Period: ________ ASSIGN Using the Scientific Method Observations vs. Inferences: Directions: Examine the photographs at your lab station. Record 2 qualitative observations, 2 quantitative observations, and 2 inferences about the photographs in the table below. Image 1 Qualitative Observations: 1. 2. Quantitative Observations: 1. 2. Inferences: 1. 2. Image 2 Qualitative Observations: 1. 2. Image 3 Qualitative Observations: 1. 2. Quantitative Observations: 1. 2. Quantitative Observations: 1. 2. Inferences: 1. Inferences: 1. 2. 2. Experimental Design: Old Wives’ Tales People sometimes give us advice for better health or well-being. Some of these "helpful hints" are true. Some aren't. People have realized for a long time that some of these hints aren't true and call them "Old Wives' Tales." An old wives' tale is an everyday statement that some people believe is true, but it usually isn't. So how can you tell good advice from an old wives’ tale? You can't just ask a grownup, as sometimes they are wrong. The only way anyone can know the truth for sure is to use the Scientific Method. Directions: Read the example below and answer the questions about the example. Then, choose one Old Wives’ Tale that you would like to do an experiment on, and design your own experiment for it. Example: Eating carrots improves your vision. My experiment: 1. Question: Does eating more carrots improve your vision? 2. Hypothesis: If you eat more carrots, then your vision will improve. 3. Experiment: Pick 300 people at random to test. Give them a vision test at the beginning of the experiment. Then divide them into 3 groups: the first group won’t eat any carrots, the second group will eat 10 carrots a day, and the third group will eat 20 carrots a day. At the end of 3 months, give everyone another vision test and compare the results among the groups. 4. Analyze Data: Compare the results. Create a graph to visually represent the results. 5. Conclusion: Was my hypothesis correct? Why? Number of People Who Improved on Vision Test 100 90 80 70 60 50 40 30 20 10 0 Number of People Who Improved on Vision Test Group 1: Group 2: Group 3: no carrots 10 carrots 20 carrots Questions for Example: 1. What was my sample size? ____________ 2. Why do think I divided my test subjects into 3 groups? 3. 4. 5. 6. 7. 8. What was the independent variable in the experiment? ___________________________________________ Where is the independent variable on the graph? ________________________________________________ What was the dependent variable in the experiment? _____________________________________________ Where is the dependent variable on the graph? __________________________________________________ What was the controlled variable in the experiment? _____________________________________________ In which step did I describe my methodology? __________________________________________________ Old Wives’ Tales: (Choose ONE) If you go outside with wet hair, you'll catch a cold. Reading in dim light will damage your eyes. Too much TV is bad for your eyes. Eating cheese before going to bed will make you have nightmares. A recipe will not work if you mix ingredients partly clockwise, partly anti-clockwise. Your experiment: 1. Question: _______________________________________________________________________________ 2. Hypothesis: _____________________________________________________________________________ 3. Experiment: How will you test your hypothesis? What will your sample size be? ______________________ _______________________________________________________________________________________ _______________________________________________________________________________________ _______________________________________________________________________________________ _______________________________________________________________________________________ _______________________________________________________________________________________ _______________________________________________________________________________________ _______________________________________________________________________________________ _______________________________________________________________________________________ _______________________________________________________________________________________ _______________________________________________________________________________________ _______________________________________________________________________________________ _______________________________________________________________________________________ _______________________________________________________________________________________ 4. Analyze Data: How will you compare your results? ______________________________________________ _______________________________________________________________________________________ _______________________________________________________________________________________ Draw a graph to show how you could visually represent your data (you do not need to fill in made-up data; just set up the graph—be sure to label your axes!) 5. Conclusion: What question should you always answer in the conclusion section? 6. 7. 8. 9. 10. 11. What was the independent variable in the experiment? ___________________________________________ Where is the independent variable on the graph? ________________________________________________ What was the dependent variable in the experiment? _____________________________________________ Where is the dependent variable on the graph? __________________________________________________ What was the controlled variable in the experiment? _____________________________________________ What are some possible problems with your experiment? (Think: is it ethical to force someone to do something that could possibly harm them?)
