1471-2466-12-76-S1
advertisement
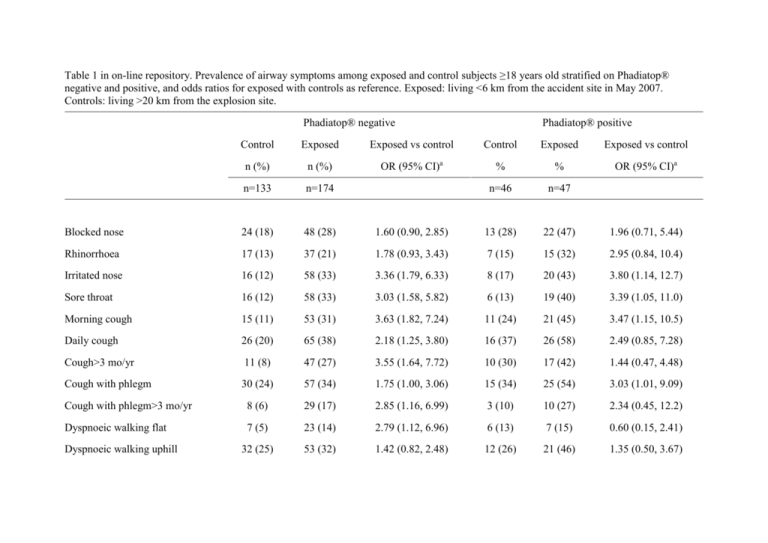
Table 1 in on-line repository. Prevalence of airway symptoms among exposed and control subjects ≥18 years old stratified on Phadiatop® negative and positive, and odds ratios for exposed with controls as reference. Exposed: living <6 km from the accident site in May 2007. Controls: living >20 km from the explosion site. Phadiatop® negative Phadiatop® positive Control Exposed Exposed vs control Control Exposed Exposed vs control n (%) n (%) OR (95% CI)a % % OR (95% CI)a n=133 n=174 n=46 n=47 Blocked nose 24 (18) 48 (28) 1.60 (0.90, 2.85) 13 (28) 22 (47) 1.96 (0.71, 5.44) Rhinorrhoea 17 (13) 37 (21) 1.78 (0.93, 3.43) 7 (15) 15 (32) 2.95 (0.84, 10.4) Irritated nose 16 (12) 58 (33) 3.36 (1.79, 6.33) 8 (17) 20 (43) 3.80 (1.14, 12.7) Sore throat 16 (12) 58 (33) 3.03 (1.58, 5.82) 6 (13) 19 (40) 3.39 (1.05, 11.0) Morning cough 15 (11) 53 (31) 3.63 (1.82, 7.24) 11 (24) 21 (45) 3.47 (1.15, 10.5) Daily cough 26 (20) 65 (38) 2.18 (1.25, 3.80) 16 (37) 26 (58) 2.49 (0.85, 7.28) Cough>3 mo/yr 11 (8) 47 (27) 3.55 (1.64, 7.72) 10 (30) 17 (42) 1.44 (0.47, 4.48) Cough with phlegm 30 (24) 57 (34) 1.75 (1.00, 3.06) 15 (34) 25 (54) 3.03 (1.01, 9.09) Cough with phlegm>3 mo/yr 8 (6) 29 (17) 2.85 (1.16, 6.99) 3 (10) 10 (27) 2.34 (0.45, 12.2) Dyspnoeic walking flat 7 (5) 23 (14) 2.79 (1.12, 6.96) 6 (13) 7 (15) 0.60 (0.15, 2.41) 32 (25) 53 (32) 1.42 (0.82, 2.48) 12 (26) 21 (46) 1.35 (0.50, 3.67) Dyspnoeic walking uphill Ever chest wheeze a 8 (6) 23 (13) 2.52 (0.99, 6.42) 13 (28) 13 (28) 0.80 (0.27, 2.36) Odds ratio (95% confidence interval) between exposed and control group from logistic regression models adjusted for smoking (present (1) vs never/ex(0)), occupational exposure (high vs low), infection in the preceding month (yes (1) vs no (0)), age (continuous scale), impact score (>=22 (1) vs <22 (0)), gender (women (1) vs men (0)). Table 2 in on-line repository. Spirometry results among exposed and control subjects aged ≥18 years old stratified on atopy status; Phadiatop® negative and positive, and adjusted arithmetic mean difference between exposed and controls. Exposed group: living < 6 km from the accident site in May 2007. Control group: living >20 km from the explosion site. Phadiatop® negative Phadiatop® positive Control Exposed Difference between exposed and control Control Exposed Difference between exposed and control AM (SD)a AM (SD)a AM difference (95% CI)b AM (SD)a AM (SD)a AM difference (95% CI)b n=122 n=148 n=40 n=43 FEV1 (mL) 3376 (825) 3264 (928) -104 (-230, 23) 3625 (945) 3296 (898) -244 (-469, -209) FEV1% predicted 93.2 (13.6) 90.0 (15.6) -2.4 (-5.9, 1.1) 91.9 (13.6) 88.1 (13.8) -2.4 (-8.1, 3.4) FVC (mL) 4410 (1007) 4254 (1072) -142 (-280, -4) 4717 (1139) 4201 (1119) -345 (-643, -47) FVC % predicted 99.8 (11.4) 97.0 (13.3) -2.7 (-5.7, 0.4) 99.1 (13.6) 93.5 (13.6) -4.4 (-10.6, 1.7) FEV1/FVC ratio a 0.766 (0.0745 0.763 (0.086) -0.004 (-0.020, 0.012) 0.768 (0.067) 0.779 (0.073) 0.006 (-0.025, 0.037) Arithmetic mean (Standard deviation). b Arithmetic mean difference (95% confidence interval) between exposed (living <6 km) and control group (living >20 km) from linear regression models adjusted for smoking (present (1) vs ex/never (0)), occupational exposure (high (1) vs low/none (0)), infection in the preceding month (yes (1) vs no (0)), height (continuous scale), age (continuous scale) and gender (women (1) vs men (0) (models for FEV1 % predicted and FVC % predicted not adjusted for height, age and gender).
