pce12317-sup-0001-si
advertisement

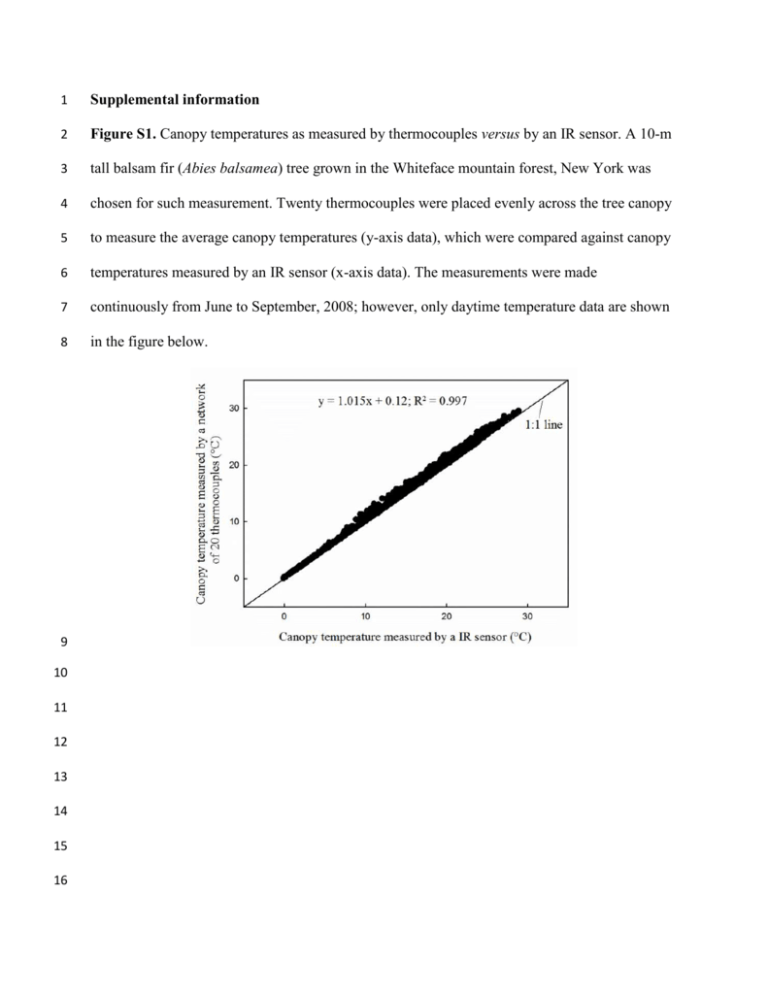
1 Supplemental information 2 Figure S1. Canopy temperatures as measured by thermocouples versus by an IR sensor. A 10-m 3 tall balsam fir (Abies balsamea) tree grown in the Whiteface mountain forest, New York was 4 chosen for such measurement. Twenty thermocouples were placed evenly across the tree canopy 5 to measure the average canopy temperatures (y-axis data), which were compared against canopy 6 temperatures measured by an IR sensor (x-axis data). The measurements were made 7 continuously from June to September, 2008; however, only daytime temperature data are shown 8 in the figure below. 9 10 11 12 13 14 15 16 17 Figure S2 Comparisons of the measured and modeled, sampling-period averaged 18Olw values 18 across the six species/year combinations. The symbols are the same as in Fig. 6a. 19 20 21 22 23 24 25 26 27 28 29 30 31 32 Figure S3 The species-specific f0-E relationships as shown in this figure were deduced based on 33 Eqns 4 & 5 using the species-specific L-E relationships as determined by Song et al. (2013). Leaf 34 temperature was assumed at 27 °C for calculating diffusivity factor D. 35 36 37 38 39 40 41 42 43 44 45 46 47 48 49 50 51 52 53 Figure S4 Results for a sensitivity analysis testing the effect of variations in late-wood formation period (t) on δ18Olc for the year 2010. For each species, the default input values for the latewood starting and ending days were the same as the values empirically determined in 2011. In a), the late-wood ending day was held to each species’ default value while the starting day was independently varied by ±5 and ±10 d. In b), the late-wood starting day was held to each species’ default value while the ending day was independently varied by ±5 and ±10 d. 54 55 56 57 58 59 60 Figure S5 Results for a sensitivity analysis testing the effect of variations in boundary conductance (gb) on δ18Olc in the years 2010 (a) and 2011 (b). Default input values of gb were 2 mol m-2 s-1 for chestnut oak, 1.7 mol m-2 s-1 for black oak, and 2.5 mol m-2 s-1 for pitch pine. For each species/year combination, values for gb were independently varied by ±50% and ±100% while all the other variables of the tree-ring model remained unchanged. 61 Note S1 Among-species variation in Tcan 62 Tcan often remains a significant source of uncertainty when it comes to interpreting tree ring 18O 63 variability in many different field settings (Helliker & Richter 2008; Song et al. 2011); yet in 64 field studies involving tree species, rarely has Tcan been directly quantified through measurement. 65 This is due in part to logistic difficulty of taking such measurement, but is also due to the 66 retrospective nature associated with most of the tree ring isotope studies. In our current study, to 67 constrain this uncertainty we used IR sensors to continuously measure Tcan on the three study 68 species throughout the major portions of both growing seasons. The results show that when 69 compared over the same period of the growing season, among-species difference in GPP- 70 weighted canopy temperature (Tcan_GPP) was rather small, and so was the deviation of Tcan_GPP 71 from GPP-weighted air temperature (Tair_GPP) (i.e., the deviations of Tcan_GPP from Tair_GPP were 72 all within 1 °C for any of the measured tree individuals from any of the three species; Fig. 5a & 73 b). As Tcan_GPP or Tair_GPP is a measure of long-term integrated canopy or air temperature that is 74 weighted toward the periods of carbon uptake, the observed small differences between Tcan_GPP 75 of the three species and Tair_GPP suggests that at least during the periods of maximal carbon 76 uptake, the three species’ canopies all displayed reasonably high degree of aerodynamic coupling 77 with the ambient atmospheric conditions. Nevertheless, it is worth pointing out that the observed 78 close match between Tcan_GPP and Tair_GPP does not preclude the possibility that substantial 79 uncoupling between tree canopies and the air can still occur sporadically, particularly in broad- 80 leaved oak trees during hot and dry days. As a matter of fact, our measurements have revealed 81 that half-hourly averaged Tcan in oak trees can be up to 3 °C higher than its ambient counterpart 82 during drought period 1 (data not shown). However, we should emphasize that such sporadic 83 occurrence of atmospheric uncoupling of tree canopy has little implication for tree ring isotope 84 signature, which is an inherent representation of canopy-level processes integrated over a long- 85 term period. Accordingly, we urge caution on any attempt to interpret tree ring isotope variability 86 based on spot measurements of tree leaf temperatures. 87 88 The calculated Tcan_GPP values as shown in Fig 5 were between 26.5 °C and 27.5 °C for the three 89 species. These values are considerably higher than the subtropical-to-boreal mean Tcan (21.4 ± 90 2.2 °C) during the period of active carbon gain, as derived from tree-ring 18O values by Helliker 91 & Richter (2008). The Tcan_GPP values in Fig. 5 were calculated over only a portion of the 92 growing season (the warmer portion of the season when late wood in oaks was synthesized). 93 GPP weighted Tcan over the entire growing season was calculated as between 23.1 and 24.2 °C 94 among the three species in the two measurement years. These values are a bit higher than the Tcan 95 mean in Helliker & Richter 2008, but are well within the range of Tcan values (~18 to 25 °C) 96 calculated from 18O of tree-ring samples collected from a nearby temperate forest site (Helliker 97 & Richter 2008). 98 99 Note S2 Among-species variation in f0 100 Through analysis of leaf water isotope data collected from multiple tree species, Song et al. 101 (2013) revealed the common presence of an inverse (negative power) relationship between L 102 and E in different species. In the current study, we took advantage of the empirical L-E 103 relationships that had been determined on chestnut oak and pitch pine in the study described in 104 Song et al. (2013) to estimate and perform comparisons of f0 values among species. As 105 exemplified in Fig. 5c & d for a fixed portion of the growing seasons, the range of the estimated 106 GPP-weighted mean f0 values across species was only about 0.04 in both 2010 and 2011, 107 indicating a lack of considerable variation in f0 among species during the periods of maximal 108 carbon uptake (but see discussions below concerning the general applicability of the Péclet 109 correction to pine species). 110 111 It should be noted that our calculation of GPP-weighted f0 requires half-hourly estimates of f0, 112 which were calculated based on half-hourly estimates of E values, modeled at the leaf level. It is 113 likely that these modeled E values may not be an accurate reflection of true E values for a 114 various reasons; nevertheless, it is interesting to note that the uncertainty associated with E 115 estimations actually have limited influence on the f0 estimates, at least in the three species that 116 we focused in the current study. To illustrate this point, we used the empirically determined L-E 117 relationships to derive the f0-E relationships for both chestnut oak and pitch pine. As 118 demonstrated in Fig. S3, although f0 exhibits some dependence on E in both species, the 119 dependence is rather limited, indicating that estimate of f0 is not sensitive to errors associated 120 with E estimation. In fact, we can view f0 in each of the species to be a “constant” despite 121 variations in E (i.e., particularly when E > 1.5 mmol m-2 s-1). This nearly-constant nature of f0 in 122 turn, suggests that the calculated GPP-weighted f0 values are fairly robust results, regardless of 123 the uncertainties associated with E estimates. 124


