File
advertisement
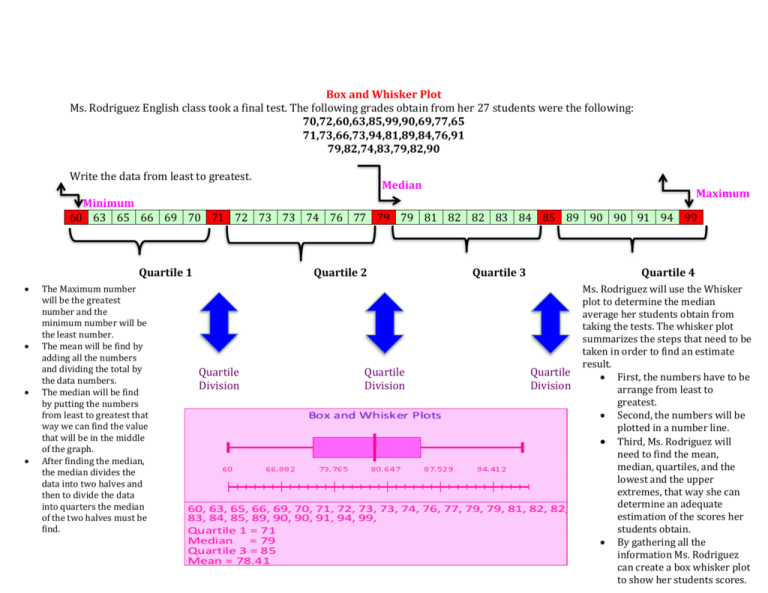
Box and Whisker Plot Ms. Rodriguez English class took a final test. The following grades obtain from her 27 students were the following: 70,72,60,63,85,99,90,69,77,65 71,73,66,73,94,81,89,84,76,91 79,82,74,83,79,82,90 Write the data from least to greatest. Median Maximum Minimum 60 63 65 66 69 70 71 72 73 73 74 76 77 79 79 81 82 82 83 84 85 89 90 90 91 94 99 Quartile 1 The Maximum number will be the greatest number and the minimum number will be the least number. The mean will be find by adding all the numbers and dividing the total by the data numbers. The median will be find by putting the numbers from least to greatest that way we can find the value that will be in the middle of the graph. After finding the median, the median divides the data into two halves and then to divide the data into quarters the median of the two halves must be find. Quartile 2 Quartile Division Quartile Division Quartile 3 Quartile 4 Quartile Division Ms. Rodriguez will use the Whisker plot to determine the median average her students obtain from taking the tests. The whisker plot summarizes the steps that need to be taken in order to find an estimate result. First, the numbers have to be arrange from least to greatest. Second, the numbers will be plotted in a number line. Third, Ms. Rodriguez will need to find the mean, median, quartiles, and the lowest and the upper extremes, that way she can determine an adequate estimation of the scores her students obtain. By gathering all the information Ms. Rodriguez can create a box whisker plot to show her students scores.


