Water Quality & Microscope Lab Worksheet
advertisement
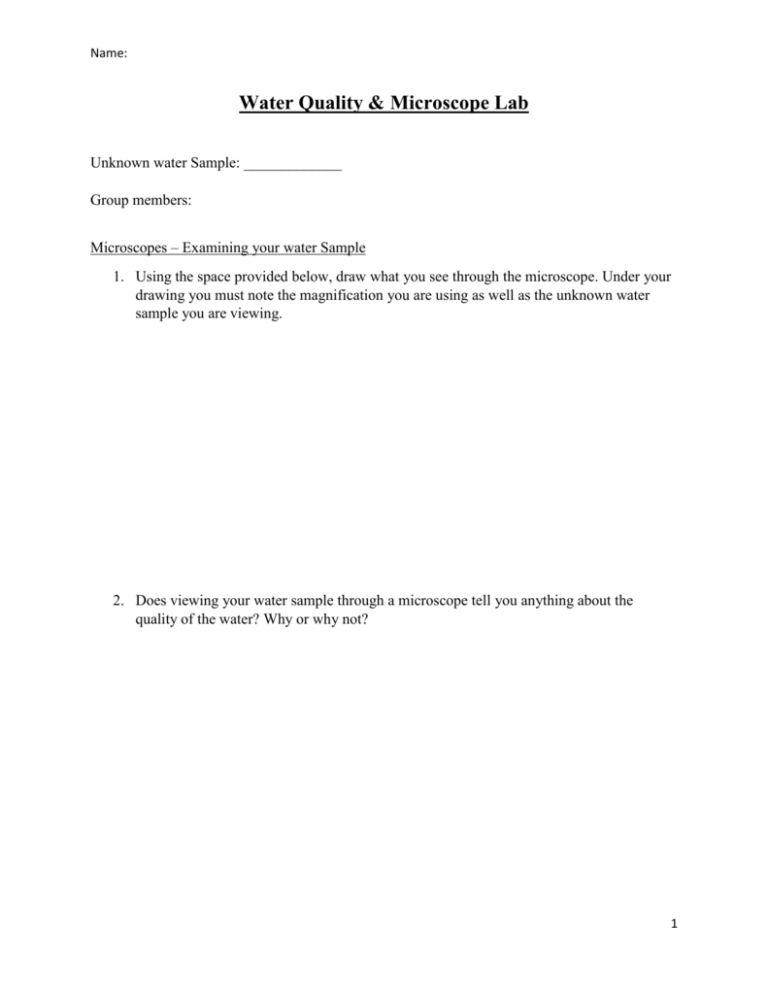
Name: Water Quality & Microscope Lab Unknown water Sample: _____________ Group members: Microscopes – Examining your water Sample 1. Using the space provided below, draw what you see through the microscope. Under your drawing you must note the magnification you are using as well as the unknown water sample you are viewing. 2. Does viewing your water sample through a microscope tell you anything about the quality of the water? Why or why not? 1 Name: Calculating water quality Use the tables below to fill out your Q-Value Chart for your unknown water sample. 1. Calculate % saturation for Dissolved oxygen Note: Barometric Pressure for Regina is approximately 760mm a. Record the dissolved oxygen reading you obtained last class. b. Record the water temperature reading of your water sample from last class. c. Using your temperature value and a barometric pressure of 760mm, record the 100% dissolved oxygen value (use Table 3 provided to your group). Type equation here. % 𝑠𝑎𝑡𝑢𝑟𝑎𝑡𝑖𝑜𝑛 = Column Reading A Dissolved oxygen (mg/L) Example Unknown Water Sample 8.2 mg/L 𝐶𝑜𝑙𝑢𝑚𝑛 𝐴 𝑣𝑎𝑙𝑢𝑒 (𝑚𝑒𝑎𝑠𝑢𝑟𝑒𝑑 𝐷. 𝑂. 𝑙𝑒𝑣𝑒𝑙) 𝑥 100 𝐶𝑜𝑙𝑢𝑚𝑒 𝐷 𝑣𝑎𝑙𝑢𝑒 (𝑠𝑎𝑡𝑢𝑟𝑎𝑡𝑒𝑑 𝐷. 𝑂. 𝑙𝑒𝑣𝑒𝑙) B Water temp (C) 18.4 C Example Calculation: C Atmospheric pressure (mmHg) 760 mmHg D 100% Dissolved oxygen (mg/L) 9.5 mg/L E Percent Saturation (%) 86% 8.2 𝑚𝑔/𝐿 % 𝑠𝑎𝑡𝑢𝑟𝑎𝑡𝑖𝑜𝑛 = 9.5 𝑚𝑔/𝐿 𝑥 100 2. Use the % Saturation value you calculated to determine your Q value for Dissolved Oxygen DO (% Saturation) 0 10 20 30 40 50 60 70 80 90 100 110 120 130 140 Q Value 0 5 12 20 30 45 57 75 85 95 100 95 90 85 80 Dissolved Oxygen Q Value for my unknown water sample: ____________________________ 2 Name: 3. Determining Q value for pH pH 2.0 2.5 3.0 3.5 4.0 4.5 5.0 5.5 6.0 6.5 7.0 7.5 8.0 8.5 9.0 9.5 Q Value 0 1 3 5 8 15 25 49 54 75 88 95 85 65 48 30 pH Q Value for my unknown water sample: ____________________________ 4. Determining Q value for temperature Temperature (C) 0 5 10 15 20 25 30 Q Value 95 75 45 30 20 15 10 Temperature Q Value for my unknown water sample: ____________________________ 5. Determining Q value for Conductivity (Total dissolved solids) Total Dissolved Solids 0 50 100 150 200 250 300 350 400 450 500 Q Value 80 90 85 78 72 65 60 52 46 40 30 Conductivity Q Value for my unknown water sample: ____________________________ 3 Name: Total of Q values Record the calculated Q values for each test in the table below under column A. Multiply these values by their weight (Column B) – this will give you the “Total Q-Value” in column C. Add the total-Q values together to get the Overall quality value. The closer your value is to 100, the better the quality of water. Note: This quality calculation is not a complete one – it only includes 4 measurements. More complete quality testing includes fecal coliform counts, biological oxygen demand, phosphate and nitrate levels, turbidity, as well as a count of the macroinvertebrates in the water. Test Dissolved Oxygen pH Conductivity Temperature Q-Value Weight 0.38 0.24 0.16 0.22 Total Q-Value Overall Quality: ______________________ Questions 1. Based on the above data, which of the 6 locations do you think your water sample came from? Justify your answer using the data. 2. Based on the data provided, what changes may need to be made to the rainbow trout tank, if any? If no changes need to be made, suggest how the acceptable Q-values of their environment may be harder to maintain as the trout increase in size. 4
