Unit 3 Lesson 1: Proving Linearity Learning Goals: Students are
advertisement
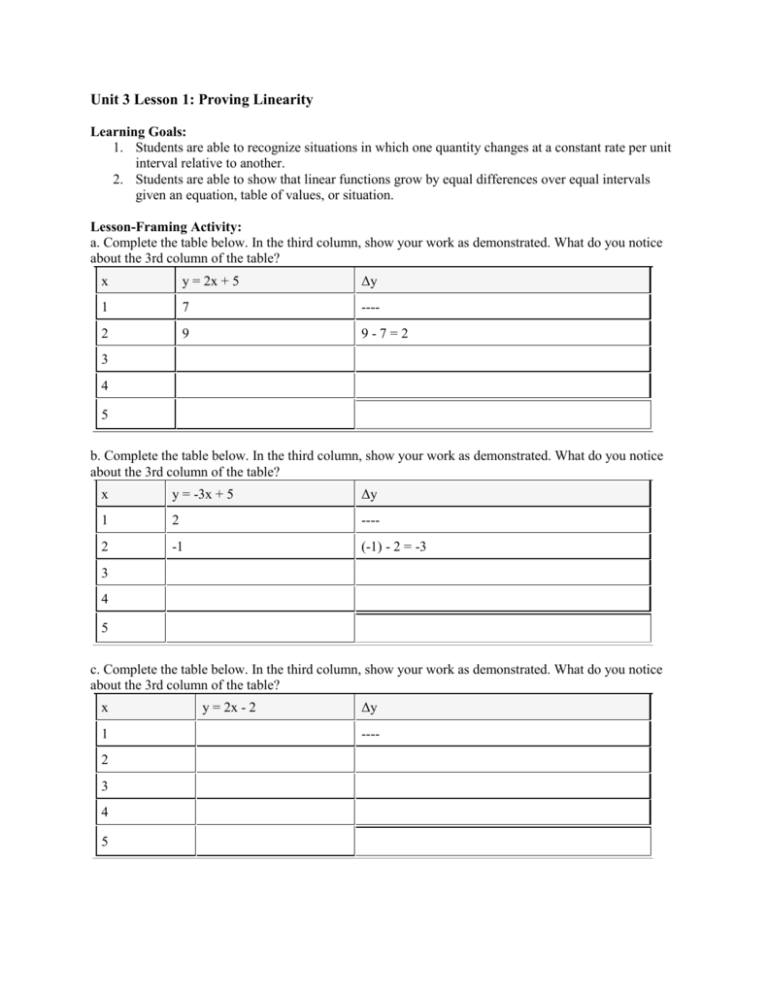
Unit 3 Lesson 1: Proving Linearity Learning Goals: 1. Students are able to recognize situations in which one quantity changes at a constant rate per unit interval relative to another. 2. Students are able to show that linear functions grow by equal differences over equal intervals given an equation, table of values, or situation. Lesson-Framing Activity: a. Complete the table below. In the third column, show your work as demonstrated. What do you notice about the 3rd column of the table? x y = 2x + 5 Δy 1 7 ---- 2 9 9-7=2 3 4 5 b. Complete the table below. In the third column, show your work as demonstrated. What do you notice about the 3rd column of the table? x y = -3x + 5 Δy 1 2 ---- 2 -1 (-1) - 2 = -3 3 4 5 c. Complete the table below. In the third column, show your work as demonstrated. What do you notice about the 3rd column of the table? x 1 2 3 4 5 y = 2x - 2 Δy ---- d. Complete the table below. In the third column, show your work as demonstrated. What do you notice about the 3rd column of the table? x Δy y = -4x - 2 1 ---- 2 3 4 5 e. Complete the table below, showing your work as above. What do you notice about the 3rd column of the table? What is the graphical interpretation of this? x y=ax+b Δy 1 a⋅1+b --- 2 a⋅2+b a⋅2+b−(a⋅1+b)=a 3 4 5 Wrap-up: f. Let y = ax + b. Let x0 be any particular x-value. Show that if x0 is increased by 1, the corresponding Δy is constant. What is this constant? Lesson: Generalizing what it means to have a constant change over a constant interval. a. From part a of the introduction activity: x y = 2x + 5 Δy 1 7 ---- 2 9 9-7=2 3 11 11 – 9 = 2 4 13 13 – 11 = 2 5 15 15 – 13 = 2 b. What happens to the rate of change when we have a different interval, but that interval is still constant? x y = 2x + 5 Δy 2 9 ---- 4 13 6 8 10 c. What happens to the rate of change when we have a different interval, but that interval is still constant? x y = 2x + 5 Δy 3 11 ---- 6 17 9 12 15 Wrap-Up: Let y(x) = ax + b. Let x0 be any particular x-value. Show that if x0 is increased by a constant Δx, the corresponding Δy is constant. What is this constant? Class Examples: Ex. 1 Marshall examined the following table of values for a function. x y -3 -9 -2 -5 -1 -1 0 3 1 7 He says that it is a linear function. Prove whether he is correct or not. Solution: Step 1: Understand Marshall examined the following table of values for a function. He says that it is a linear function. Prove whether he is correct or not. Step 2: Plan Linear functions change by equal differences over equal intervals. We should calculate the differences over equal intervals. If the differences are equal to one another over equal intervals, then Marshall is correct. This is a linear function. Step 3: Carry out plan Examine the domain (input) values and see that they all change by a value of 1. So, we have an equal change for each interval. Next, add a column to calculate the change in range (output) values for those equal intervals. x y Change -3 -9 -2 -5 -5 – (-9) = 4 -1 -1 -1 – (-5) = 4 0 3 3 – (-1) = 4 1 7 7–3=4 Step 4: Check We were asked to prove whether or not Marshall was correct about this function being a linear function. We used the definition of a linear functions (equal change over equal intervals) to show that this was in fact a linear function. Thus, he is correct. Lesson Summary: Distinguishing between situations that can be modeled with linear functions depends on understanding that linear functions have constant rates of change. In order to determine if a function is linear, we need to see if it has equal differences over equal intervals, given, for example, in a table of values drawn from the situation. Practice & Fluency: 1. Sartha examines the following table of values for a function: x y -1 15/7 0 3 1 27/7 2 33/7 3 39/7 Sartha says that this does not represent a linear function since some y-values are fractions and some are not. Therefore, there can’t be an equal difference over equal intervals. Prove whether she is correct or not. Solution: Step 1: Understand Step 2: Plan Step 3: Carry out plan x y -1 15/7 0 3 1 27/7 2 33/7 3 39/7 Step 4: Check 2. The figure below shows the graphs of the functions represented by f(x)=4x−a and g(x)=2x+b for some constants a and b. They intersect at the point (p,q). a. Label the graph of f. Do the same for the graph of g. b. What do a and b represent in the graphs above? c. Imagine you place the tip of your pencil at point (p,q) and trace the graph of f out to the point with x-coordinate p+2. Imagine I do the same on the graph of g. How much greater would the ycoordinate of your ending point be than mine? 3. You are starting a small business and purchased a new smartphone. You are trying to get a 15 gigabyte data plan for your phone so you can conduct your business with it. All the cell phone companies only show plans up to 10 gigabytes of data. So, you ask a salesman and he says, “I’m new here, but the chart says one gigabyte of data costs $15 per month, 3 gigabytes of data costs $35 per month, 4 gigabytes of data costs $40 per month, and six gigabytes of data costs $70. Since it looks costs the same amount of money per gigabyte of $15, it should be $225 for 30 gigabytes. Is his reasoning built on sound mathematics? Why or why not? Step 1: Understand Step 3: Carry out plan Step 2: Plan Step 4: Check 4. Which statement describes a situation that has a constant rate of change? 1. Alexa deposits $100 into a savings account. 2. Alexa deposits $10.00 each month into a savings account. 3. Alexa deposits $100 into a savings account that earns 5% interest each month. 4. Alexa deposits $5 into a savings account the first month, and then doubles the amount she deposits each month. 5. Which account balance would best be modeled by a linear function? 1. a loan with no interest being paid at $300 per month 2. a loan with a 3% monthly interest rate being paid at $300 per month 3. a savings account earning 3% interest per month with no deposits made 4. a checking account with a balance that increases one month and decreases the next month Which table of values represents a linear function? A. x f(x) 4 12 5 15 6 18.75 7 23.4375 B. x f(x) 4 15 7 24 9 30 15 48 C. x 1 2 3 4 D. x -1 0 1 2 f(x) 10 11 10 7 f(x) 3.375 4.5 6 8 Which scenario could be modeled by a linear function? 1. the population of a city that is growing by 3% each year 2. the amount of carbon in a sample that is decaying by half every 6 hours 3. the number of calories burned when running at a constant speed 4. the height of a rocket 6 hours after takeoff Four students in a class created a pattern of five numbers. The table below shows the pattern each student created. Term 1 Term 2 Term 3 Term 4 Term 5 Ashley 2 4 8 16 32 Hector 25 31 37 43 49 Jamal 5,000 1,000 200 40 8 Karina 350 50 250 850 1,150 Which student created a pattern that changes by a constant amount from term to term? 1. Ashley 2. Hector 3. Jamal 4. Karina Exit Ticket: The data in the table below was taken from Wikipedia. Year World Population (Estimate) 1804 1 1927 2 1960 3 1974 4 1987 5 1999 6 2012 7 a. Based on the data in the above table, would a linear function be appropriate to model the relationship between the world population and the year? Explain how you know. b. Using only the data from 1960 onward in the above table, would a linear function be appropriate to approximate the relationship between the world population and the year? Explain how you know. c. Based on your work in parts (a) and (b), would a linear function be appropriate to predict the world population in 2200? Explain.

![The Average rate of change of a function over an interval [a,b]](http://s3.studylib.net/store/data/005847252_1-7192c992341161b16cb22365719c0b30-300x300.png)
