Algebra 1 Summer Institute 2014 The Table Categorization
advertisement
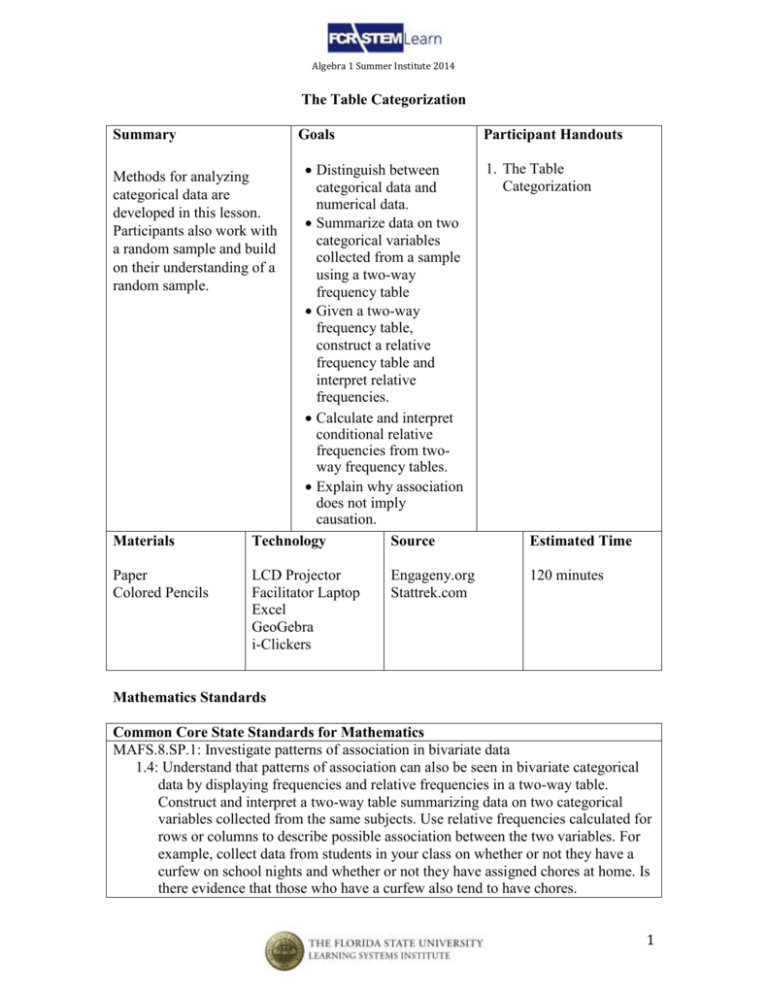
Algebra 1 Summer Institute 2014 The Table Categorization Summary Goals Participant Handouts Distinguish between categorical data and numerical data. Summarize data on two categorical variables collected from a sample using a two-way frequency table Given a two-way frequency table, construct a relative frequency table and interpret relative frequencies. Calculate and interpret conditional relative frequencies from twoway frequency tables. Explain why association does not imply causation. Technology Source Methods for analyzing categorical data are developed in this lesson. Participants also work with a random sample and build on their understanding of a random sample. Materials Paper Colored Pencils LCD Projector Facilitator Laptop Excel GeoGebra i-Clickers Engageny.org Stattrek.com 1. The Table Categorization Estimated Time 120 minutes Mathematics Standards Common Core State Standards for Mathematics MAFS.8.SP.1: Investigate patterns of association in bivariate data 1.4: Understand that patterns of association can also be seen in bivariate categorical data by displaying frequencies and relative frequencies in a two-way table. Construct and interpret a two-way table summarizing data on two categorical variables collected from the same subjects. Use relative frequencies calculated for rows or columns to describe possible association between the two variables. For example, collect data from students in your class on whether or not they have a curfew on school nights and whether or not they have assigned chores at home. Is there evidence that those who have a curfew also tend to have chores. 1 Algebra 1 Summer Institute 2014 MAFS.912.S-ID.2: Summarize, represent, and interpret data on two categorical and quantitative variables 2.5: Summarize categorical data for two categories in two-way frequency table. Interpret relative frequencies in the context of the data (including joint, marginal, and conditional relative frequencies). Recognize possible associations and trends in the data. Standards for Mathematical Practice 1. Make sense of problems and persevere in solving them 2. Reason abstractly and quantitatively 3. Construct viable arguments and critique the reasoning of others 4. Model with mathematics 5. Use tools appropriately Instructional Plan Categorical data are often summarized in the media, research studies, or general discussions. However, categorical data are summarized differently than numerical data. There is no mean or median that answers the question “What is your favorite soft drink?” Methods for analyzing categorical data are developed in this activity. The two-way frequency table is used to develop a relative frequency table that will allow participants to compare the responses of males and females. However, the statistical question is still not clearly answered. As participants complete the exercises in this activity, they begin to see the need for conditional relative frequencies. Participants also begin to understand how conditional summaries will be used to answer the statistical question. One-way Table A one-way table refers to one variable. A one-way table is the tabular equivalent of a bar chart. Like a bar chart, a one-way table displays categorical data in the form of frequency counts and/or relative frequencies. 1. Example: using the i-clickers, ask participants for their favorite color between: (Slide 2) a. b. c. d. e. Red Orange Yellow Green Blue 2 Algebra 1 Summer Institute 2014 2. Display the results as a bar chart using GeoGebra or Excel. (Slide 3) 3. Transfer the results to a frequency one-way table. Compare the table to the bar chart. Choice Red Orange Yellow Green Blue Frequency 4. When a one-way table shows relative frequencies (i.e., percentages or proportions) for particular categories of a categorical variable, it is called a relative frequency table. (Slide 4) Convert the frequencies to proportions and then to percentages. 5. What statistical question could be answered with this data? Two-way Tables Statisticians use two-way tables and segmented bar charts to examine the relationship between two categorical variables. Entries in the cells of a two-way table can be displayed as frequency counts or as relative frequencies (just like a one-way table). Or they can be displayed graphically as a segmented bar chart. 6. Example: The two-way table shows the favorite leisure activities for 50 adults 20 men and 30 women. Because entries in the table are frequency counts, the table is a frequency table. Dance Sports Total Male 4 16 20 Female 18 12 30 Total 22 28 50 7. Entries in the "Total" row and "Total" column are called marginal frequencies or the marginal distribution. Entries in the body of the table are called joint frequencies. If we looked only at the marginal frequencies in the Total row, we might conclude that the two activities had roughly equal appeal. Yet, the joint frequencies show a 3 Algebra 1 Summer Institute 2014 strong preference for dance among women, and little interest in dance among men. 8. We can also display relative frequencies in two-way tables. The relative frequencies in the body of the table are called conditional frequencies or the conditional distribution. The tables below show preferences for leisure activities in the form of proportions and relative frequencies. (Slide 6) Dance Sports Total Male 4/50 16/50 20/50 Female 18/50 12/50 30/50 Total 22/50 28/50 50/50 Male Female Total Dance Sports Total .08 .32 .40 .36 .24 .60 .44 .56 1.00 9. Two-way tables can show relative frequencies for the whole table, like the one above. The following tables show relative frequencies for rows: (Slide 7) Dance Sports Total Male 4/20 16/20 20/20 Female 18/30 12/30 30/30 Total 22/50 28/50 50/50 Dance Sports Total Male .20 .80 1.00 Female .60 .40 1.00 Total .44 .56 1.00 The tables below show relative frequencies for columns. Dance Sports Total Male 4/22 16/28 20/50 Female 18/22 12/28 30/50 Total 22/22 28/28 50/50 Dance Sports Total 4 Algebra 1 Summer Institute 2014 Male Female Total .18 .82 1.00 .57 .43 1.00 .40 .60 1.00 10. Each type of relative frequency table makes a different contribution to understanding the relationship between gender and preferences for leisure activities. For example, "Relative Frequency for Rows" table most clearly shows the probability that each gender will prefer a particular leisure activity. For instance, it is easy to see that the probability that a man will prefer dance is 20%; the probability that a woman will prefer dance is 60%; the probability that a man will prefer sports is 80%; and so on. The relative frequency for columns show that there is a big difference in the percent of women that prefer dance compared to men (82% to 18%), however, the difference in sports is not so noticeable (57% for men and 43% for women). 11. The information can also be displayed in a segmented bar graph. The following pictures shows the segmented or stacked bar graphs done in Excel: Possible association based on Conditional Relative Frequencies (Slide 8) Two categorical variables are associated if the row conditional relative frequencies (or column relative frequencies) are different for the rows (or columns) of the table. For example, if the selection of leisure activities selected for females is different than the selection of leisure activities for males, then gender and leisure activities are associated. This difference indicates that knowing the gender of a person in the sample indicates something about their activity preference. The evidence of an association is strongest when the conditional relative frequencies are quite different. If the conditional relative frequencies are nearly equal for all categories, then there is probably not an association between 5 Algebra 1 Summer Institute 2014 variables. Examine the conditional relative frequencies in the two-way table of conditional relative frequencies. Note that for each activity, the conditional relative frequencies are different for females and males. Male Female Total Dance Sports Total .08 .32 .40 .36 .24 .60 .44 .56 1.00 Male Female Total Dance Sports Total .18 .57 .40 .82 .43 .60 1.00 1.00 1.00 1. For what activity would you say that the conditional relative frequencies for females and males are very different? 2. For what activities are the conditional relative frequencies nearly equal for males and females? 3. Suppose a person is selected at random from the people who completed the survey. If you had to predict which activity this person selected, would it be helpful to know the person’s gender? Explain your answer. 4. Is there evidence of an association between gender and favorite activity? Explain why or why not. Association and Cause and Effect The following example will introduce the important idea that you should not infer a cause-and-effect relationship from an association between two categorical variables. Students were given the opportunity to prepare for a college placement test in mathematics by taking a review course. Not all students took advantage of this opportunity. The following results were obtained from a random sample of students who took the placement test: (Slide 9) Placed in Placed in Math 200 Math 100 Took Review Course Did not take Review Placed in Math 50 Total 40 13 7 60 10 15 15 40 6 Algebra 1 Summer Institute 2014 Course Total 50 28 22 100 Read through the example with participants. Pose the following questions to the class. Let participants discuss their ideas. Do you think there is an association between taking the review course and a student’s placement in a math class? If you knew that a student took a review course, would it make a difference in what you predicted for which math course they were placed in? Do you think taking a course caused a student to place higher in a math placement? Let participants work in groups of two to construct a row conditional relative frequency table. Placed in Math 200 Placed in Math 100 Placed in Math 50 Took review course 𝟒𝟎 ≈ 𝟎. 𝟔𝟔𝟕 𝟔𝟎 𝟏𝟑 ≈ 𝟎. 𝟐𝟏𝟕 𝟔𝟎 𝟕 ≈ 𝟎. 𝟏𝟏𝟕 𝟔𝟎 Did not take review course 𝟏𝟎 = 𝟎. 𝟐𝟓𝟎 𝟒𝟎 𝟏𝟓 = 𝟎. 𝟑𝟕𝟓 𝟒𝟎 𝟏𝟓 = 𝟎. 𝟑𝟕𝟓 𝟒𝟎 Total 𝟐𝟖 𝟓𝟎 = 𝟎. 𝟐𝟖𝟎 = 𝟎. 𝟓𝟎𝟎 𝟏𝟎𝟎 𝟏𝟎𝟎 𝟐𝟐 𝟏𝟎𝟎 = 𝟎. 𝟐𝟐𝟎 Total 𝟔𝟎 𝟔𝟎 = 𝟏. 𝟎𝟎𝟎 𝟒𝟎 𝟒𝟎 = 𝟏. 𝟎𝟎𝟎 𝟏𝟎𝟎 𝟏𝟎𝟎 = 𝟏. 𝟎𝟎𝟎 1. Based on the conditional relative frequencies, is there evidence of an association between whether a student takes the review course and the math course in which the student was placed? Explain your answer. (Slide 11) There is evidence of association as the conditional relative frequencies are noticeably different for those students who took the course and those students who did not take the course. 7 Algebra 1 Summer Institute 2014 2. Looking at the conditional relative frequencies, the proportion of students who placed into Math 200 is much higher for those who took the review course than for those who did not. One possible explanation is that taking the review course caused improvement in placement test scores. What is another possible explanation? Another possible explanation is that students who took the review course are more interested in mathematics or were already better prepared in mathematics and, therefore, performed better on the mathematics placement test. 3. Do you think that this is an example of a cause-and-effect relationship? Be sure that they understand that even though there is an association, this does not mean that there is a cause and effect relationship. Now consider the following statistical study: Fifty students were selected at random from students at a large middle school. Each of these students was classified according to sugar consumption (high or low) and exercise level (high or low). The resulting data are summarized in the following frequency table. (Slide 12) Sugar Consumption High Low Total Exercise Level High Low 14 18 14 4 28 22 Total 32 18 50 1. Calculate the row conditional relative frequencies, and display them in a row conditional relative frequency table. High Sugar Consumption Low Exercise Level High Low 𝟏𝟒 𝟏𝟖 𝟑𝟐 𝟑𝟐 = 𝟎. 𝟒𝟑𝟕𝟓 = 𝟎. 𝟓𝟔𝟐𝟓 𝟏𝟒 ≈ 𝟎. 𝟕𝟕𝟖 𝟏𝟖 𝟒 ≈ 𝟎. 𝟐𝟐𝟐 𝟏𝟖 Total 𝟑𝟐 𝟑𝟐 = 𝟏. 𝟎𝟎𝟎 𝟏𝟖 𝟏𝟖 = 𝟏. 𝟎𝟎𝟎 8 Algebra 1 Summer Institute 2014 Total 𝟐𝟖 = 𝟎. 𝟓𝟔 𝟓𝟎 𝟐𝟐 = 𝟎. 𝟒𝟒 𝟓𝟎 𝟓𝟎 𝟓𝟎 = 𝟏. 𝟎𝟎𝟎 2. Is there evidence of an association between sugar consumption category and exercise level? Support your answer using conditional relative frequencies. There is a noticeable difference in the conditional relative frequencies based on whether a person selected had high or low sugar consumption. The differences suggest an association between sugar consumption and exercise level. 3. Do you think it is reasonable to conclude that high sugar consumption is the cause of the observed differences in the conditional relative frequencies? What other explanations could explain a difference in the conditional relative frequencies? Explain your answer. Participants are encouraged to think about their responses to this exercise based on their understanding that the results should not be interpreted as a cause-and-effect relationship. Other factors such as eating habits and lifestyle could be mentioned by students. 4. It is possible that students in the above study who are more health conscious tend to be in the low sugar consumption category and also tend to be in the high exercise level category. 5. It is not possible to determine if the difference in the conditional relative frequencies is due to a cause-and-effect relationship. 6. The data summarized in this study were collected in an observational study. In an observational study, any observed differences in conditional relative frequencies might be explained by some factor other than the variables examined in the study. With an observational study, evidence of an association may exist, but it is not possible to imply that there is a cause-and-effect relationship. 9

