Chapter 2: Frequency Distributions and Graphs
advertisement
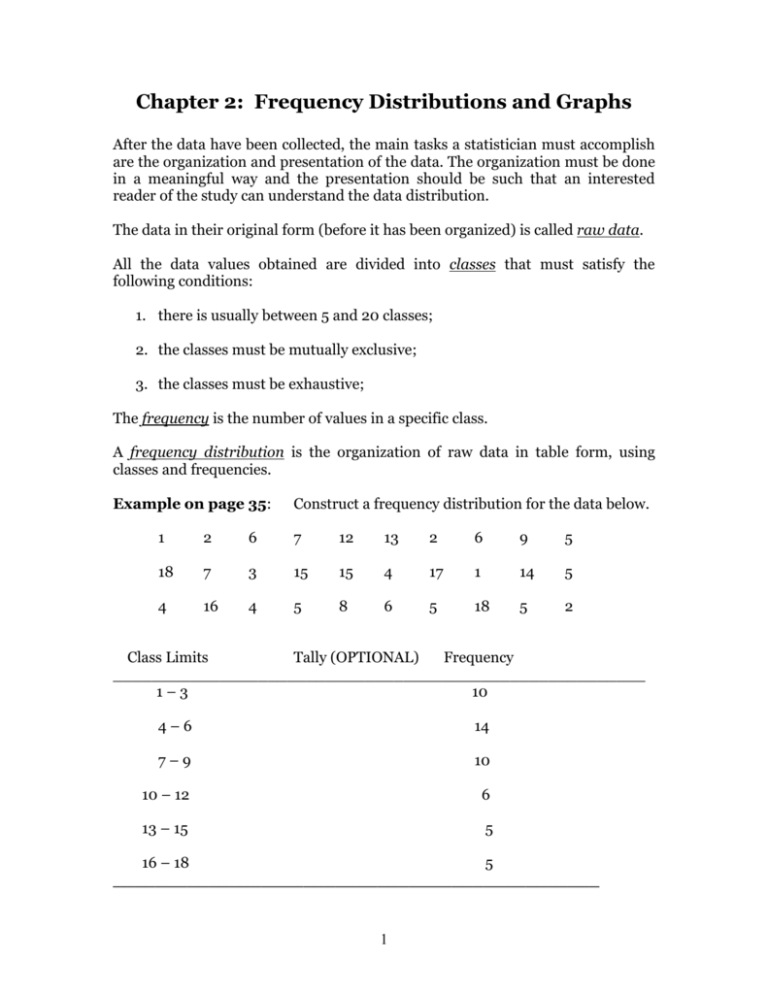
Chapter 2: Frequency Distributions and Graphs After the data have been collected, the main tasks a statistician must accomplish are the organization and presentation of the data. The organization must be done in a meaningful way and the presentation should be such that an interested reader of the study can understand the data distribution. The data in their original form (before it has been organized) is called raw data. All the data values obtained are divided into classes that must satisfy the following conditions: 1. there is usually between 5 and 20 classes; 2. the classes must be mutually exclusive; 3. the classes must be exhaustive; The frequency is the number of values in a specific class. A frequency distribution is the organization of raw data in table form, using classes and frequencies. Example on page 35: Construct a frequency distribution for the data below. 1 2 6 7 12 13 2 6 9 5 18 7 3 15 15 4 17 1 14 5 4 16 4 5 8 6 5 18 5 2 Class Limits Tally (OPTIONAL) Frequency _______________________________________________________ 1–3 10 4–6 14 7–9 10 10 – 12 6 13 – 15 5 16 – 18 5 ______________________________________________ 1 Total = 30 The types of frequency distributions that are used the most are the categorical frequency distribution and the grouped frequency distribution. Categorical Frequency Distributions: The categorical frequency distribution is used for data that can be placed in specific categories or represent values of a qualitative variable. Example on p. 36: Construct a frequency distribution for the data below. A B B AB O O O B AB B B B O A O A O O O AB AB A O B A Class Tally Frequency (f) Percent _______________________________________________________ A 5 20 B 7 28 O 9 36 AB 4 16 ______________________________________________________ Sum of Frequency (n) = 25 Total percent= 100 Grouped Frequency Distributions: When the data are numerical and their range is large, the data must be grouped into classes that are more than one unit in length. 2 In this case we have additional conditions for the classes: 4. the class width should be preferably an odd number; 5. the classes must be equal in width; 6. the classes must be continuous. The procedure for constructing a grouped frequency distribution is described in the next example. Example on p. 39: The data represent the record high temperatures for each of the 50 states. Construct a grouped frequency distribution for the data using 7 classes. 112 110 107 116 120 100 118 112 108 113 127 117 114 110 120 120 116 115 121 117 134 118 118 113 105 118 122 117 120 110 105 114 118 119 118 110 114 122 111 112 109 105 106 104 114 112 109 110 111 114 Step 1: Determine the classes Find the highest value and the lowest value and use them to find the range. Range = highest value in the data set – lowest value=134-100=34 Find the class width by dividing the range by the number of classes. Round the answer up to the next whole number if there is a remainder. The class width is the difference between the lower class limit of one class and the lower class limit of the next class. Class width=Range/number of classes (rounded up to the closest odd number)=34/7 ~ 5 Use your lowest value as your starting point. Add the class width to the starting point to get the lower limit for the next class. Keep adding until there are 7 classes. Subtract 1 from the lower limit of the second class to get the upper limit of the first class. 3 Step 2: Find the class boundaries Find the class boundaries by subtracting 0.5 from each lower class limit and adding 0.5 to each upper class limit. In future calculations we will also need to find the midpoints Xm of each class. Xm=(higher limit of the class+lower limit of the class)/2 Step 3: Tally the data and find the numerical frequencies from the tallies. Step 4: Find the cumulative frequencies The cumulative frequency for a class is the sum of the frequencies for that class and all previous classes. To find this value, add up all the frequencies that lead up to each class. Now let us construct our frequency distribution: Class Limits Class Boundaries Frequency (f) HW: p. 43-44, Ex. 7-17 (odd). 4 Cumulative Frequency Midpoints (Xm)

