Ch. 3 Review and Reinforce Answer Key
advertisement
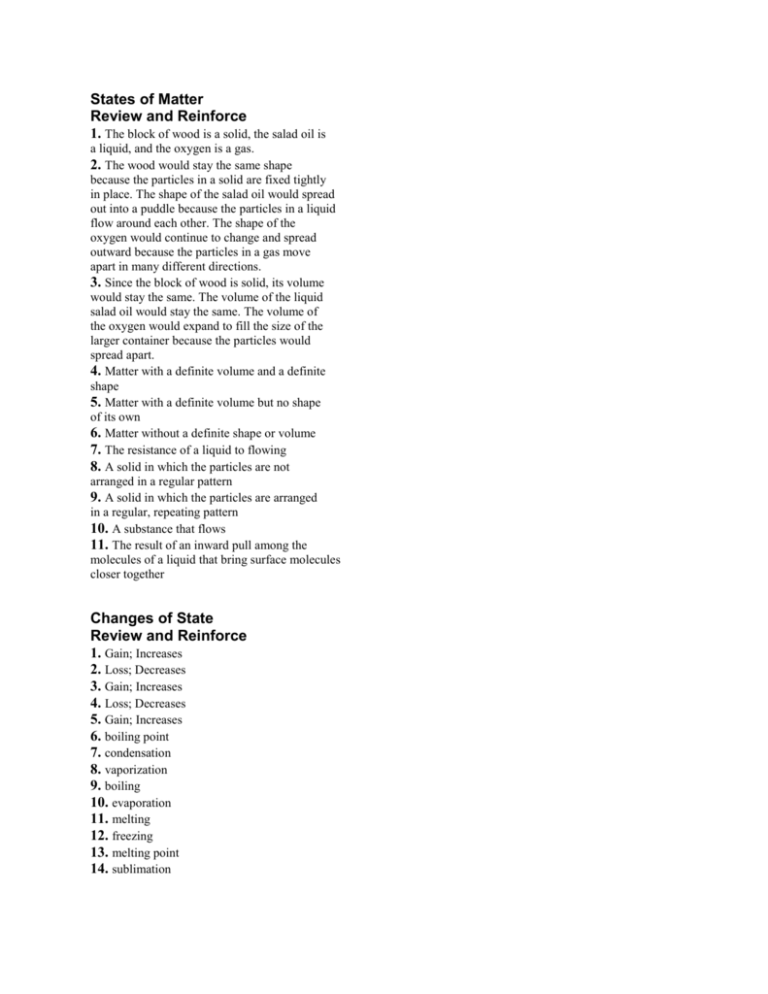
States of Matter Review and Reinforce 1. The block of wood is a solid, the salad oil is a liquid, and the oxygen is a gas. 2. The wood would stay the same shape because the particles in a solid are fixed tightly in place. The shape of the salad oil would spread out into a puddle because the particles in a liquid flow around each other. The shape of the oxygen would continue to change and spread outward because the particles in a gas move apart in many different directions. 3. Since the block of wood is solid, its volume would stay the same. The volume of the liquid salad oil would stay the same. The volume of the oxygen would expand to fill the size of the larger container because the particles would spread apart. 4. Matter with a definite volume and a definite shape 5. Matter with a definite volume but no shape of its own 6. Matter without a definite shape or volume 7. The resistance of a liquid to flowing 8. A solid in which the particles are not arranged in a regular pattern 9. A solid in which the particles are arranged in a regular, repeating pattern 10. A substance that flows 11. The result of an inward pull among the molecules of a liquid that bring surface molecules closer together Changes of State Review and Reinforce 1. Gain; Increases 2. Loss; Decreases 3. Gain; Increases 4. Loss; Decreases 5. Gain; Increases 6. boiling point 7. condensation 8. vaporization 9. boiling 10. evaporation 11. melting 12. freezing 13. melting point 14. sublimation Gas Behavior Review and Reinforce 1. that pressure increases 2. that pressure decreases 3. that volume increases 4. On a hot day, the pressure of the gas would increase. On a cold day, the pressure would decrease. 5. 6. The speed of the particles increases. 7. c 8. b 9. d 10. a Graphing Gas Behavior Review and Reinforce 1. Graph A—Charles’s law Graph B—Boyle’s law 2. Graph A—The variables are directly proportional because their graph is a straight line that passes through the origin. Graph B—The variables vary inversely because a line connecting the graphed points makes a curve that slopes downward from left to right and is less steep near the x-axis than the y-axis. 3. Answers may vary slightly. a. about 80 cm3 b. about 50 kPa 4. A diagram showing the relationship of two variables 5. When graphed, the line connecting the points makes a curve that slopes downward from left to right and is less steep near the x-axis than the y-axis. 6. The graph of two variables that are directly proportional is a straight line that passes through the origin.
