KEY BUDGET DRIVER FORECASTS 2013-14 to 2006-17
advertisement

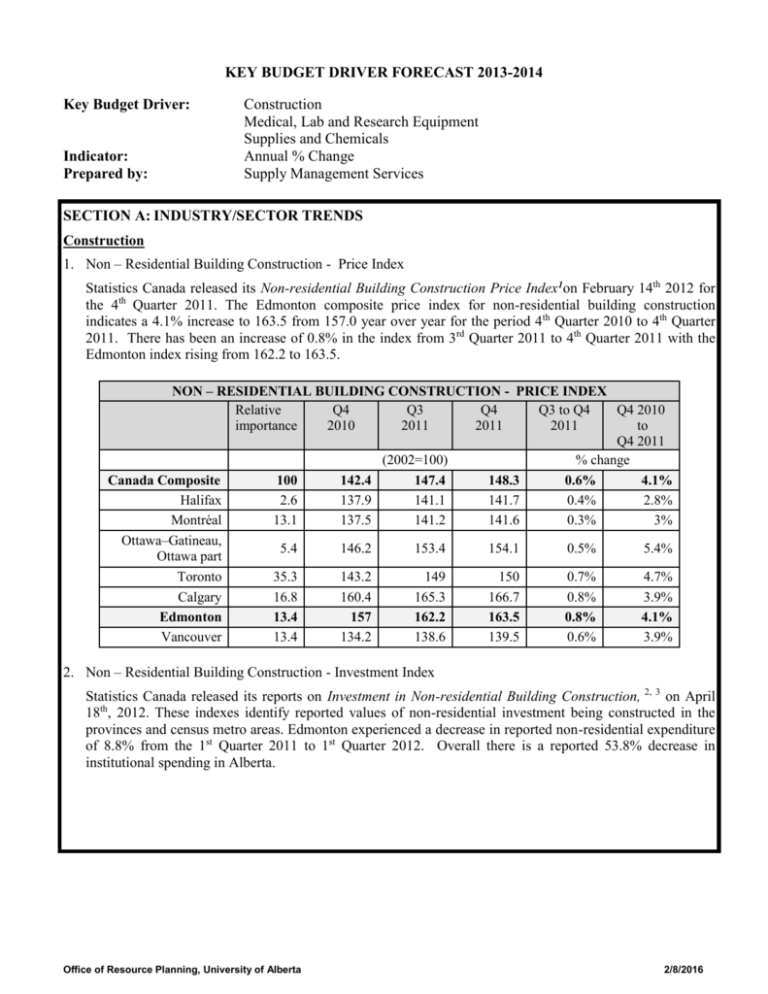
KEY BUDGET DRIVER FORECAST 2013-2014 Key Budget Driver: Indicator: Prepared by: Construction Medical, Lab and Research Equipment Supplies and Chemicals Annual % Change Supply Management Services SECTION A: INDUSTRY/SECTOR TRENDS Construction 1. Non – Residential Building Construction - Price Index Statistics Canada released its Non-residential Building Construction Price Index1on February 14th 2012 for the 4th Quarter 2011. The Edmonton composite price index for non-residential building construction indicates a 4.1% increase to 163.5 from 157.0 year over year for the period 4th Quarter 2010 to 4th Quarter 2011. There has been an increase of 0.8% in the index from 3rd Quarter 2011 to 4th Quarter 2011 with the Edmonton index rising from 162.2 to 163.5. NON – RESIDENTIAL BUILDING CONSTRUCTION - PRICE INDEX Relative Q4 Q3 Q4 Q3 to Q4 Q4 2010 importance 2010 2011 2011 2011 to Q4 2011 (2002=100) % change Canada Composite 100 142.4 147.4 148.3 0.6% 4.1% Halifax 2.6 137.9 141.1 141.7 0.4% 2.8% Montréal 13.1 137.5 141.2 141.6 0.3% 3% Ottawa–Gatineau, 5.4 146.2 153.4 154.1 0.5% 5.4% Ottawa part Toronto 35.3 143.2 149 150 0.7% 4.7% Calgary 16.8 160.4 165.3 166.7 0.8% 3.9% Edmonton 13.4 157 162.2 163.5 0.8% 4.1% Vancouver 13.4 134.2 138.6 139.5 0.6% 3.9% 2. Non – Residential Building Construction - Investment Index Statistics Canada released its reports on Investment in Non-residential Building Construction, 2, 3 on April 18th, 2012. These indexes identify reported values of non-residential investment being constructed in the provinces and census metro areas. Edmonton experienced a decrease in reported non-residential expenditure of 8.8% from the 1st Quarter 2011 to 1st Quarter 2012. Overall there is a reported 53.8% decrease in institutional spending in Alberta. Office of Resource Planning, University of Alberta 2/8/2016 ALBERTA: INVESTMENT IN NON-RESIDENTIAL BUILDING CONSTRUCTION PROVINCE Q1 2011 Alberta (total non-res.) Industrial Institutional Commercial $2,215 $280 $636 $1,299 Q4 2011 Q1 2011 to to Q1 2012 Q1 2012 Seasonally adjusted $ millions % change $2,180 $2,197 0.8% -0.8% $285 $305 7.2% 8.9% $329 $294 -10.6% -53.8% $1,567 41,598 2.0% 23.1% Q4 2011 Q1 2012 ALBERTA: INVESTMENT IN NON-RESIDENTIAL BUILDING CONSTRUCTION METRO REGIONS Q1 2011 Edmonton Calgary Q4 2011 Q1 2012 Seasonally adjusted $ millions $704 $630 $642 $819 $833 $835 Q4 2011 to Q1 2012 Q1 2011 to Q1 2012 % change 1.8% -8.8% 0.2% 1.9% Medical, Lab And Research Equipment, Supplies And Chemicals 1. Industry Trends and Costs The University has established a Preferred Supplier Agreement for the supply of medical, lab and research equipment as well as supplies and chemicals. The Supplier has informed that global costs have increased 3.5% this last year which is being passed on to customers. These increases are attributed to the rise in the price of oil which is used to manufacture many laboratory products and is a key cost component in transportation and utilities. Raw material prices on base metals declined significantly in 2011 and have remained flat.1 2. Research and Development / Market Trends Typical Research and Development investment ranges from 7% to 10% of sales. Top line growth for 2012 2013 is estimated to be 5-7% in research and industrial products and 1% in clinical. The trend to consolidate purchases from fewer suppliers continues. 1 The commentary on Industry Trends and Costs is based on SMS review of the following publications: www.indexmundi.com/commodities www.moneycontrol.com www.commodityblog.com Office of Resource Planning, University of Alberta 2/8/2016 SECTION B: TRENDS WITHIN THE UNIVERSITY OF ALBERTA 1. Construction The University constructs its major capital projects using a variety of methods including Construction Management, Lump Sum Price, Design-Build and variations thereof. Construction of the Edmonton Radiopharmaceutical Clinic is being completed using a Design-Build construction delivery model. Construction of the Physical Activity and Wellness begins in May 2012 and will be delivered using a Construction Management delivery model. The Innovation Centre Engineering is currently under construction using a Stipulated Lump Sum Price model. For Alberta Non-Residential Construction, the Construction Sector Council is forecasting a 0.8% increase in 2012/2013 and a decrease of 1.0% in 2013/14 and an increase of 4.9% in 2014/15. The percentages in this report are the projections as of the beginning of May 2012.4 2. Medical, Lab And Research Equipment, Supplies And Chemicals Approved equipment and fit out expenditures are either complete or near completion for the Edmonton Clinic Health Academy (North and South), Katz Rexall Centre for Pharmacy and Health Research and the Li Ka Shing Institute of Virology. CFI and AET grant funding for the next two years total $33,104,958. There may be a variance in this number as the final reporting will not be available until July. This figure represents active projects and does not include new funding applications or any anticipated new awards. This figure is higher than previous forecast of $13M in 12/13, and $10M in 13/14. SECTION C: KEY BUDGET DRIVER FORECASTS INDICATOR: TOP 5 AND ANNUAL % CHANGE 11/12 Actuals 12/13 Forecast 13/14 Forecast 14/15 Forecast 15/16 Forecast 16/17 Forecast 1. Alberta Non-Residential Construction4 3.8% 0.8% -1.0% 4.9% 5.3% 7.3% 2. Medical, Lab and Research Equipment, Supplies and Chemicals 3.5% 4.0% 5.0% 5.0% 5.0% 5.0% Indicator 1. Construction Source: Statistics Canada 1, 2, 3 1 Statistics Canada Non-residential Building Construction Price Index (http://www.statcan.gc.ca/dailyquotidien/120214/t120214b1-eng.htm). Base Year Composite Index is 2002 = 100. 2 Statistics Canada Investment in Non-residential Building Construction – Provinces (http://www.statcan.gc.ca/daily-quotidien/120418/t120418a001-eng.htm) 3 Statistics Canada Investment in Non-residential Building Construction – Metro Areas (http://www.statcan.gc.ca/daily-quotidien/120418/t120418a002-eng.htm) 4 Construction Sector Council (2011 - 2020): http://www.constructionforecasts.ca/forecast/browse source data from Statistics Canada, Bank of Canada, CMHC, HRSDC. 2. Medical, Lab and Research Equipment, Supplies and Data Data compiled from Suppliers, the Canadian Laboratory Suppliers Association, the Montreal Gazette (Div. of Canwest Publishing), Statistics Canada (Health), Canada Foundation for Innovation. Office of Resource Planning, University of Alberta 2/8/2016


