Sara
advertisement
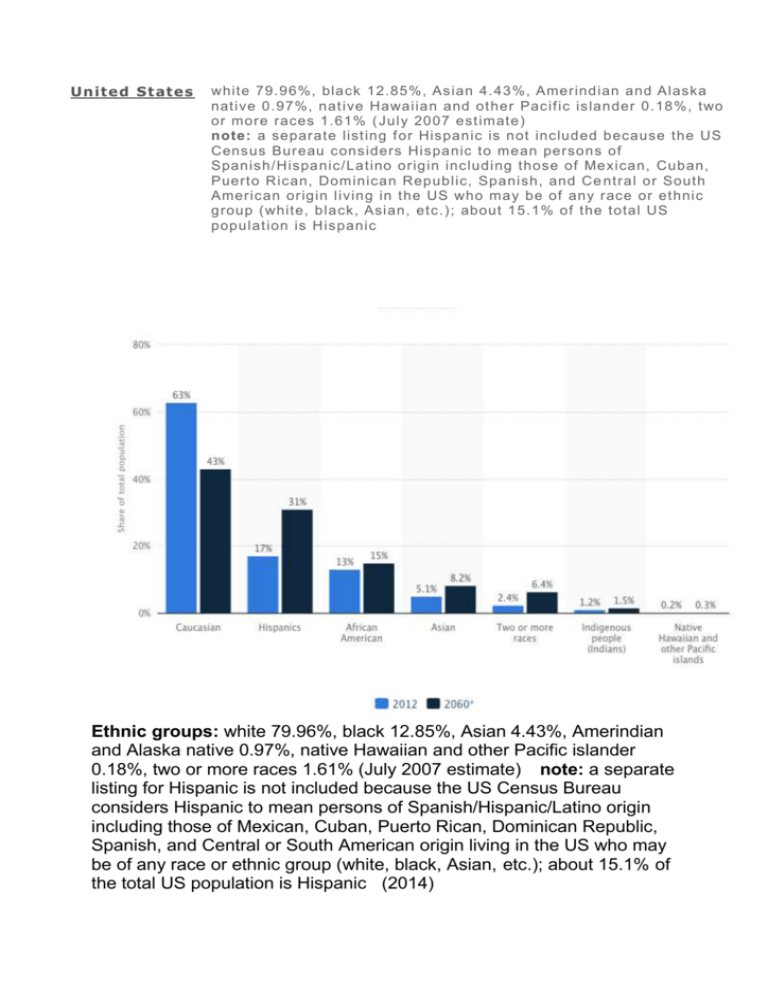
United States white 79.96%, black 12.85%, Asian 4.43%, Amerindian and Alaska native 0.97%, nat ive Hawaiian and ot her Pacif ic islander 0.18%, two or more races 1.61% ( July 2007 est imate) note: a separate list ing f or Hispanic is not included because the US Census Bur eau considers Hispanic to mean persons of Spanish/Hispanic/Latino or igin including those of Mexican, Cuban, Puerto Rican, Dom inican Republic, Spanish, and Ce ntral or South American or igin living in the US who may be of any race or ethnic group (white, black, Asian, etc.); about 15.1% of the total US populat ion is Hispanic Ethnic groups: white 79.96%, black 12.85%, Asian 4.43%, Amerindian and Alaska native 0.97%, native Hawaiian and other Pacific islander 0.18%, two or more races 1.61% (July 2007 estimate) note: a separate listing for Hispanic is not included because the US Census Bureau considers Hispanic to mean persons of Spanish/Hispanic/Latino origin including those of Mexican, Cuban, Puerto Rican, Dominican Republic, Spanish, and Central or South American origin living in the US who may be of any race or ethnic group (white, black, Asian, etc.); about 15.1% of the total US population is Hispanic (2014) How many immigrants reside in the United States? According to estimates from the 2013 ACS, the U.S. immigrant population stood at more than 41.3 million, or 13 percent, of the total U.S. population of 316.1 million. Between 2012 and 2013, the foreign-born population increased by about 523,000, or 1.3 percent. U.S. immigrants and their U.S.-born children now number approximately 80 million persons, or one-quarter of the overall U.S. population. Check out the figure Number and Share of Total U.S. Population, 1850-2013 in MPI’s Data Hub to see how the immigrant share of the overall population has fluctuated over time. What are the historical numbers and shares of immigrants in the United States? Data on the nativity of the U.S. population were first collected in the 1850 decennial census. That year, there were 2.2 million immigrants in the United States, representing almost 10 percent of the total population. Between 1860 and 1920, the immigrant share of the total population fluctuated between 13 and 15 percent, peaking at 15 percent in 1890, mainly due to high levels of European immigration. Restrictive immigration legislation in 1921 and 1924, coupled with the Great Depression and World War II, led to a sharp drop in new arrivals. As a result, the foreign-born share steadily declined between the 1930s and 1970s, reaching a record low of approximately 5 percent in 1970 (9.6 million). Since 1970, the share and number have increased rapidly, mainly as a result of large-scale immigration from Latin America and Asia made possible by changes to admission rules adopted by Congress in 1965. Since 1970, the number of U.S. immigrants more than quadrupled as it grew from 9.6 million in 1970 to 41.3 million in 2013. Unauthorized Immigration How many unauthorized immigrants are in the United States? According to DHS’ Office of Immigration Statistics (OIS), an estimated 11.4 million unauthorized immigrants resided in the United States as of January 2012 compared to 11.5 million in January 2011. These results suggest little to no change in the unauthorized immigrant population from 2011 to 2012. MPI developed detailed profiles with estimates and characteristics of the unauthorized immigrant population for the United States overall, 41 states and the District of Columbia, and 94 counties with the largest unauthorized populations. The highest shares of the 11.4 million unauthorized immigrants resided in California (28 percent), Texas (13 percent), New York (8 percent), and Florida (6 percent). Together, the top four states accounted for about 55 percent of all unauthorized immigrants. Twothirds of unauthorized immigrants resided in 94 counties, with the top five counties—Los Angeles, CA; Harris, TX; Cook, IL; Orange, CA; and Queens, NY—accounting for close to 20 percent of all unauthorized immigrants. Where are unauthorized migrants from? According to MPI estimates, about 8.1 million (71 percent of the total unauthorized population) unauthorized immigrants in the 2008-12 period were born in Mexico and other Central America countries. About 1.5 million (13 percent) were from Asia; 817,000 (7 percent) from South America; 455,000 (4 percent) from Europe, Canada, or Oceania; 317,000 (3 percent) from Africa; and 225,000 (2 percent) from the Caribbean. Mexico (58 percent), Guatemala (6 percent), El Salvador (3 percent), Honduras (2 percent), and China (2 percent) were the top five countries of birth of the unauthorized immigrant population.


