NJ Water Quality
advertisement
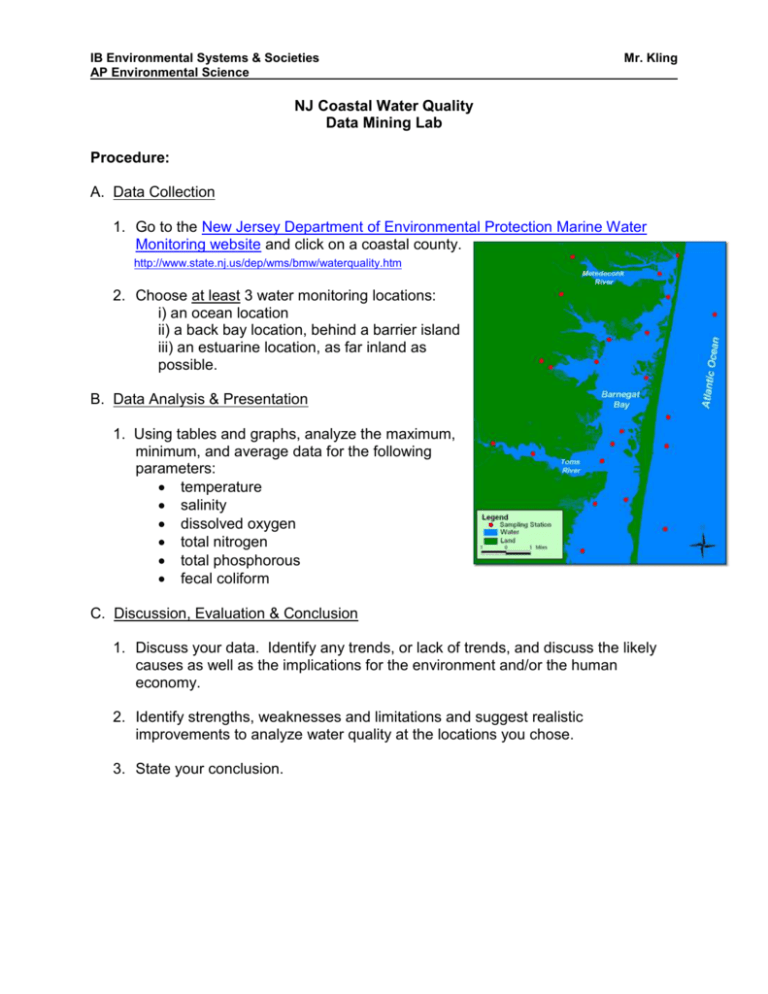
IB Environmental Systems & Societies AP Environmental Science Mr. Kling NJ Coastal Water Quality Data Mining Lab Procedure: A. Data Collection 1. Go to the New Jersey Department of Environmental Protection Marine Water Monitoring website and click on a coastal county. http://www.state.nj.us/dep/wms/bmw/waterquality.htm 2. Choose at least 3 water monitoring locations: i) an ocean location ii) a back bay location, behind a barrier island iii) an estuarine location, as far inland as possible. B. Data Analysis & Presentation 1. Using tables and graphs, analyze the maximum, minimum, and average data for the following parameters: temperature salinity dissolved oxygen total nitrogen total phosphorous fecal coliform C. Discussion, Evaluation & Conclusion 1. Discuss your data. Identify any trends, or lack of trends, and discuss the likely causes as well as the implications for the environment and/or the human economy. 2. Identify strengths, weaknesses and limitations and suggest realistic improvements to analyze water quality at the locations you chose. 3. State your conclusion. Water Quality Indicators Note on units: μg/L = micrograms per liter, or 1 part per billion (ppb). mg/L = milligrams per liter, or 1 part per million (ppm). 1 mg/L = 1000 μg/L Nitrate: Nitrogen compounds are essential for healthy plant growth. Therefore, nitrogen is a major constituent of commercial fertilizers. Unfortunately, nitrogen and nitrates enter groundwater and surface water from fertilizer runoff, sewer and sewage-treatment discharges, and industrial processes. Nitrogen is also discharged to the atmosphere from the combustion of fossil fuel. Excess nitrogen in the aquatic ecosystem can stimulate plant growth and cause eutrophication and algal blooms, or "red tides." Acceptable levels for total nitrogen are in the range of about 0.5 – 0.9 mg/L, or 500 – 900 μg/L. Phosphate: Like nitrogen, phosphate is essential for healthy plant growth and is a major constituent of commercial fertilizers. Also like nitrogen, phophates enter groundwater and surface water from fertilizer runoff, sewer and sewage-treatment discharges. Excess phosphate in the aquatic ecosystem, especially when combined with nitrogen, can stimulate plant growth and cause eutrophication and algal blooms, or "red tides." Acceptable levels for total phosphorous are in the range of about 7 – 50 μg/L. Dissolved Oxygen Dissolved oxygen analysis measures the amount of gaseous oxygen (O 2) dissolved in an aqueous solution. Oxygen gets into water by diffusion from the surrounding air, by aeration (rapid movement), and as a waste product of photosynthesis. Adequate dissolved oxygen is necessary for good water quality. Natural stream purification processes provide adequate oxygen levels for a healthy and balanced aquatic ecosystem. Some aquatic species are more sensitive to DO levels than others. Acceptable levels for DO are in the range of 6 to 15 ppm, or mg/L. Below 5 ppm the aquatic environment is hypoxic, in which there is an oxygen deficit and aquatic life is stressed. Fecal Coliform The presence of fecal coliform in aquatic environments may indicate that the water has been contaminated with the fecal material of humans or other animals. Fecal coliform bacteria can enter rivers through direct discharge of waste from mammals and birds, from agricultural and storm runoff, and from human sewage. There are several ways fecal coliform bacteria are measured. One commonly used method is the most probable number (MPN) method, in which the results are reported as most probable number (MPN) of fecal coliform bacteria per 100 ml of water. For drinking water, most authorities mandate a complete absence of fecal coliform. For Class 1 primary waters, which include human-contact activities such as swimming, rafting, and kayaking, regulations generally require levels below 200 fecal coliforms per 100 ml. For Class 2 Waters, which include noncontact activities such as fishing, boating, and other streamside or lakeside recreation, regulations generally require levels below 2000 fecal coliforms per 100 ml.
