tpj12622-sup-0015-SupplementalMeterialandMethods
advertisement
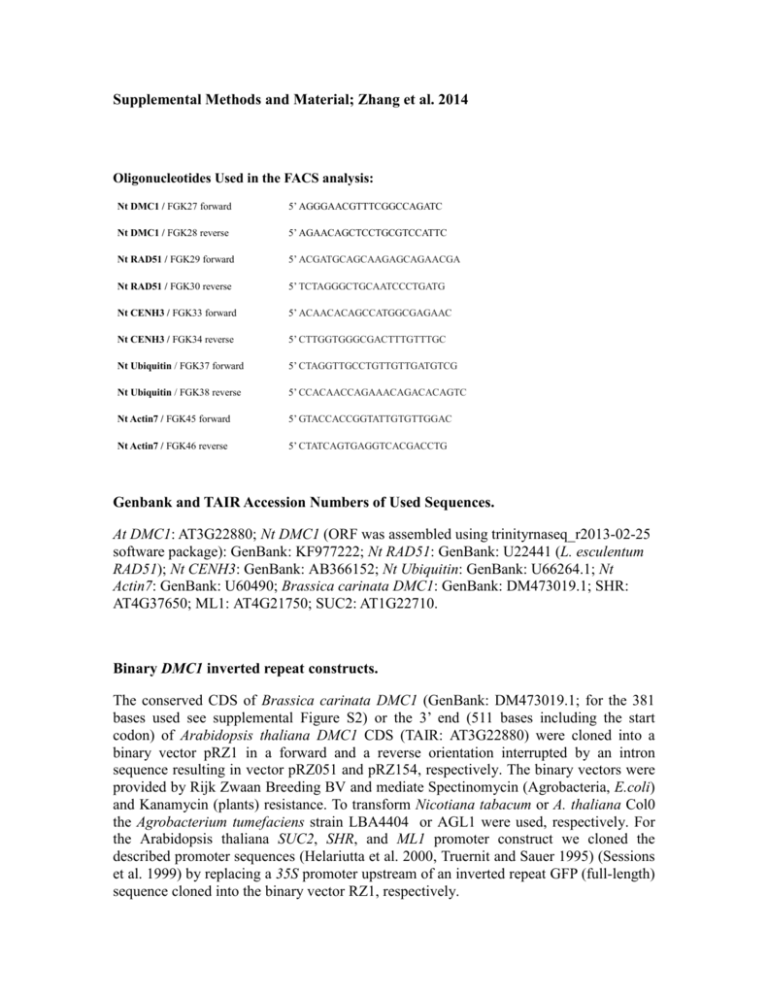
Supplemental Methods and Material; Zhang et al. 2014 Oligonucleotides Used in the FACS analysis: Nt DMC1 / FGK27 forward 5’ AGGGAACGTTTCGGCCAGATC Nt DMC1 / FGK28 reverse 5’ AGAACAGCTCCTGCGTCCATTC Nt RAD51 / FGK29 forward 5’ ACGATGCAGCAAGAGCAGAACGA Nt RAD51 / FGK30 reverse 5’ TCTAGGGCTGCAATCCCTGATG Nt CENH3 / FGK33 forward 5’ ACAACACAGCCATGGCGAGAAC Nt CENH3 / FGK34 reverse 5’ CTTGGTGGGCGACTTTGTTTGC Nt Ubiquitin / FGK37 forward 5’ CTAGGTTGCCTGTTGTTGATGTCG Nt Ubiquitin / FGK38 reverse 5’ CCACAACCAGAAACAGACACAGTC Nt Actin7 / FGK45 forward 5’ GTACCACCGGTATTGTGTTGGAC Nt Actin7 / FGK46 reverse 5’ CTATCAGTGAGGTCACGACCTG Genbank and TAIR Accession Numbers of Used Sequences. At DMC1: AT3G22880; Nt DMC1 (ORF was assembled using trinityrnaseq_r2013-02-25 software package): GenBank: KF977222; Nt RAD51: GenBank: U22441 (L. esculentum RAD51); Nt CENH3: GenBank: AB366152; Nt Ubiquitin: GenBank: U66264.1; Nt Actin7: GenBank: U60490; Brassica carinata DMC1: GenBank: DM473019.1; SHR: AT4G37650; ML1: AT4G21750; SUC2: AT1G22710. Binary DMC1 inverted repeat constructs. The conserved CDS of Brassica carinata DMC1 (GenBank: DM473019.1; for the 381 bases used see supplemental Figure S2) or the 3’ end (511 bases including the start codon) of Arabidopsis thaliana DMC1 CDS (TAIR: AT3G22880) were cloned into a binary vector pRZ1 in a forward and a reverse orientation interrupted by an intron sequence resulting in vector pRZ051 and pRZ154, respectively. The binary vectors were provided by Rijk Zwaan Breeding BV and mediate Spectinomycin (Agrobacteria, E.coli) and Kanamycin (plants) resistance. To transform Nicotiana tabacum or A. thaliana Col0 the Agrobacterium tumefaciens strain LBA4404 or AGL1 were used, respectively. For the Arabidopsis thaliana SUC2, SHR, and ML1 promoter construct we cloned the described promoter sequences (Helariutta et al. 2000, Truernit and Sauer 1995) (Sessions et al. 1999) by replacing a 35S promoter upstream of an inverted repeat GFP (full-length) sequence cloned into the binary vector RZ1, respectively. Scanning Electron Microscopy (SEM) and Confocal Laser Scanning Microscopy. SEM images of pollen were obtained with a Hitachi Tabletop Scanning Electron Microscope TM-1000 or with gold-coated pollen and anthers using a JEOL JSM-6390. Confocal laser scanning microscopy (CLSM; Upright Zeiss LSM-510 Meta, Leica SP2, or Leica SP5) of GFP, YFP fluorescence, DAPI, Propidium Iodide, HPTS, and fluorescein on plant material was performed according to established imaging protocols (Winter et al. 2007, Yoo et al. 2004) using the sequential channel scan mode with a maximum aerial pinhole of 1.5. To compare auto-fluorescence (background control) intensity with stained or transgenic plant material the same settings such as laser power, gain voltage, pinhole, objective, magnification, and channel / filter wavelengths were used. Z-stack images were assembled and processed using the Image J software package (NIH). Note that for all shown auto-fluorescence GFP / YFP / HPTS / fluorescein control images the same or more sensitive gain settings as in the presented result images were used to evaluate and ensure the specific presence of the fluorescent reporter molecules. Dye Loading Assays. HPTS (8 – Hydroxypyrene - 1, 3, 6 - trisulfonic acid trisodium salt, Sigma) and fluorescein was used at a concentration of 5mg/ml dissolved with water. The dyes were loaded into Arabidopsis plants at cut petioles or inflorescent stem for the indicated time period. After loading meiotic stage flower (1-2mm) were sectioned and analyzed by CLSM using the 405nm laser for HPTS and the 488nm laser for fluorescein. Adult N. tabacum plants were loaded by cutting the stem >15cm below an inflorescence and the cutting surface was immersed in the loading solution for the indicated time period. Meiotic stage flowers (<5mm) were dissected and analyzed under the CLSM. Following basic hardware settings for HPTS detection were used: Detection Channel 1 (green): 467 to 543 nm; Detection Channel 2 (red): not used; Detection Channel 3 (blue; Chloroplast/plastid auto-fluorescence): 695 to 765 nm. The Channel 1 gain (PMT) was set between 500 - 600 V. Next Generation (SOLEXA) Sequencing (NGS) of RNA. Total RNA (15 µg) from the second to the forth floral buds (<5 mm) emerging on the scions of five individual grafted Nicotiana tabacum and anthers and carpels of 5 agroinfiltrated Nicotiana benthamiana plants (per construct used) was isolated, for small RNA size separated (<50-mer) and submitted to reverse transcription reactions and SOLEXA sequencing (Illumina HiSeq2000; indexed probes; LGC Genomics, Berlin). Adaptor and index sequences were removed prior to performing sequence analysis to identify DMC1 matching sequences using SEGEMEHL software vs 0.0.9.3 (Hoffmann et al. 2009). Sequences used to identify DMC1-related small RNA fragments were Brassica carinata DMC1 GenBank: DM473019.1. For quality control we included query sequences of selected published Nicotiana sp. miRNAs (Amin et al. 2011) and NtMet-tRNA. Sequences used for the analysis of miRNAs and tRNA were: miR156 5’ GTGCTCACTCTCTTCTGTCA 3’ miR169 5’ TCGGCAAGTCATCCTTGGCTG 3’ miR170 5’ GATATTGACACGGCTCAATCA 3’ Nt Met tRNA: 5’ ATCAGAGTGGCGCAGCGGAAGCGTGGTGGGCCCATAA CCCACAGGTCCCAGGATCGAAACCTGGCTCTGATA 3’ Parameter used to find siRNA fragments with identical and similar sequences via the SEGEMEHL software were the following: minimal length of sequence 18; accuracy 95%. For identifying GFP mRNA matching sequences following parameter were used: minimal length of sequence 100; accuracy 95%. The alignment file was imported into Excel (Microsoft) and sorted according to found mismatches, length, and identity of the matching query sequences. The original data from SOLEXA sequencing can be requested per email to the corresponding author. Pollen Shape Image Analysis. To evaluate the pollen quality from confocal images as an indicator for misshaped pollen due to DMC1 silencing, we implemented an unbiased imaging analysis tool using Python (http://www.python.org/), its scikit-image image processing package (http://scikitimage.org/) and its scikit-learn machine learning package (http://scikit-learn.org/). In order to classify if a propidium iodide stained pollen is abnormal shaped in a confocal laser scanning image we implemented a support vector machine (SVM) using two training datasets: (i) 41 z-stack images from pollen samples of ten wild-type plants and (ii) 28 z-stack images from pollen samples harvested from eight individual DMC1 siRNA plants with predominantly misshaped pollen as determined by FACS and SEM. We processed the confocal microscopy image stacks of pollen as follows: First, an image z-stack was merged into one picture using the maximum intensity of each pixel. The second step was to segment the pollen from the background by defining a simple intensity cut-off. Third, pollen connected to the image border and overlapping pollen were filtered out using a maximal size cut-off. After image processing, the training datasets contained image information gained from 5365 wild-type pollen and from 3925 DMC1 siRNA pollen. Each pollen shape is portrayed by three features, its size and two shape factors (aspect ratio and circularity). The aspect ratio (AR) is defined as the ratio between the smallest and the largest diameter orthogonal to each other. The AR ranges from nearly 0 for very elongated objects to 1 for circles. 𝐴𝑅 = 𝑆𝑚𝑎𝑙𝑙𝑒𝑠𝑡 𝑑𝑖𝑎𝑚𝑒𝑡𝑒𝑟 𝐿𝑎𝑟𝑔𝑒𝑠𝑡 𝑑𝑖𝑎𝑚𝑒𝑡𝑒𝑟 The circularity (CI) is defined as a function of area and perimeter also ranging from 0 to 1 for circles. 𝐶𝐼 = 4𝜋 ∗ 𝐴𝑟𝑒𝑎 𝑃𝑒𝑟𝑖𝑚𝑒𝑡𝑒𝑟 2 The support vector machine (SVM) (radial basis function kernel) was trained using the two control datasets (containing approximately 10000 pollen images) and the three features (size, AR and CI). To improve the classification quality we used a minimum prediction probability of 70% (default: >50%). Pollen with lower probability of being misshaped were classified as “ambiguous” (see Fig. S9 and Table S2 of the processing pipeline). The difference was tested using a Chi-square test of independence of variables in a contingency table (p-value: 0). Pollen from grafting experiments were classified with the trained SVM and statistically validated in the same way (see Table S1). REFERENCES: Amin, I., Patil, B.L., Briddon, R.W., Mansoor, S. and Fauquet, C.M. (2011) A common set of developmental miRNAs are upregulated in Nicotiana benthamiana by diverse begomoviruses. Virol J, 8, 143. Helariutta, Y., Fukaki, H., Wysocka-Diller, J., Nakajima, K., Jung, J., Sena, G., Hauser, M.T. and Benfey, P.N. (2000) The SHORT-ROOT gene controls radial patterning of the Arabidopsis root through radial signaling. Cell, 101, 555-567. Hoffmann, S., Otto, C., Kurtz, S., Sharma, C.M., Khaitovich, P., Vogel, J., Stadler, P.F. and Hackermuller, J. (2009) Fast mapping of short sequences with mismatches, insertions and deletions using index structures. PLoS Comput Biol, 5, e1000502. Sessions, A., Weigel, D. and Yanofsky, M.F. (1999) The Arabidopsis thaliana MERISTEM LAYER 1 promoter specifies epidermal expression in meristems and young primordia. Plant Journal, 20, 259-263. Truernit, E. and Sauer, N. (1995) The promoter of the Arabidopsis thaliana SUC2 sucrose-H+ symporter gene directs expression of beta-glucuronidase to the phloem: evidence for phloem loading and unloading by SUC2. Planta, 196, 564570. Winter, N., Kollwig, G., Zhang, S. and Kragler, F. (2007) MPB2C, a microtubuleassociated protein, regulates non-cell-autonomy of the homeodomain protein KNOTTED1. Plant Cell, 19, 3001-3018. Yoo, B.-C., Kragler, F., Varkonyi-Gasic, E., Haywood, V., Archer-Evans, S., Lee, Y.M., Lough, T.J. and Lucas, W.J. (2004) A Systemic Small RNA Signaling System in Plants. Plant Cell, 16.


