Lab 05: The Atmosphere: Temperature and Humidity Variations
advertisement
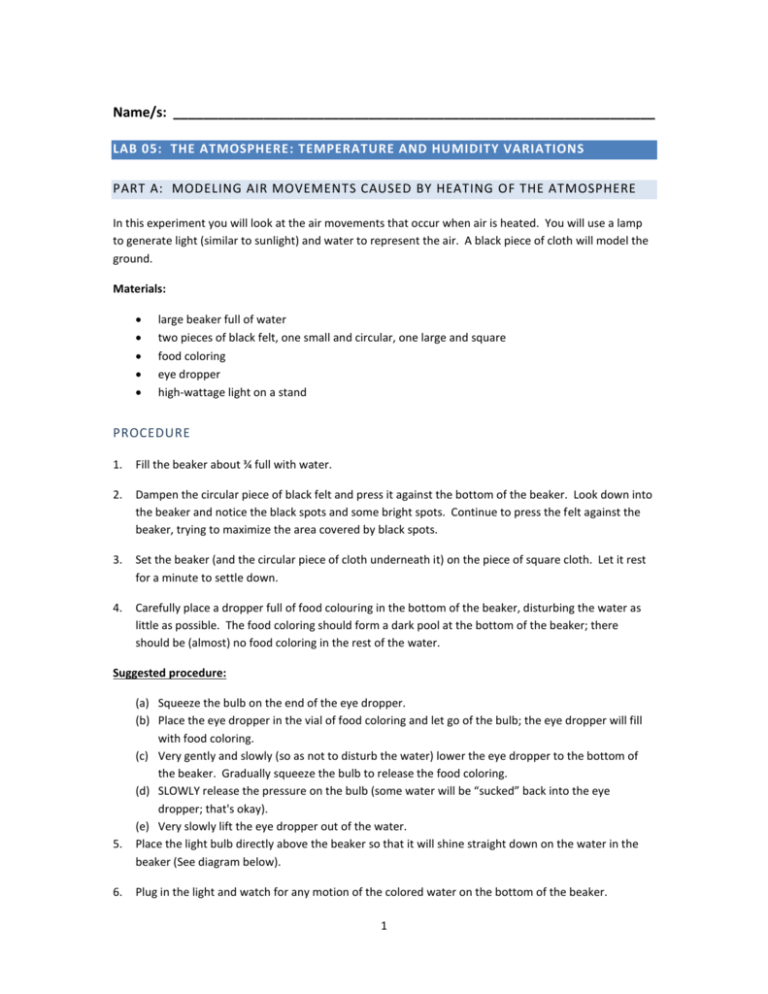
Name/s: ________________________________________________________________ LAB 05: THE ATMOSPHERE: TEMPERATURE AND HUMIDITY VARIATIONS PART A: MODELING AIR MOVEMENTS CAUSED BY HEATING OF THE ATMOSPHERE In this experiment you will look at the air movements that occur when air is heated. You will use a lamp to generate light (similar to sunlight) and water to represent the air. A black piece of cloth will model the ground. Materials: large beaker full of water two pieces of black felt, one small and circular, one large and square food coloring eye dropper high-wattage light on a stand PROCEDURE 1. Fill the beaker about ¾ full with water. 2. Dampen the circular piece of black felt and press it against the bottom of the beaker. Look down into the beaker and notice the black spots and some bright spots. Continue to press the felt against the beaker, trying to maximize the area covered by black spots. 3. Set the beaker (and the circular piece of cloth underneath it) on the piece of square cloth. Let it rest for a minute to settle down. 4. Carefully place a dropper full of food colouring in the bottom of the beaker, disturbing the water as little as possible. The food coloring should form a dark pool at the bottom of the beaker; there should be (almost) no food coloring in the rest of the water. Suggested procedure: 5. 6. (a) Squeeze the bulb on the end of the eye dropper. (b) Place the eye dropper in the vial of food coloring and let go of the bulb; the eye dropper will fill with food coloring. (c) Very gently and slowly (so as not to disturb the water) lower the eye dropper to the bottom of the beaker. Gradually squeeze the bulb to release the food coloring. (d) SLOWLY release the pressure on the bulb (some water will be “sucked” back into the eye dropper; that's okay). (e) Very slowly lift the eye dropper out of the water. Place the light bulb directly above the beaker so that it will shine straight down on the water in the beaker (See diagram below). Plug in the light and watch for any motion of the colored water on the bottom of the beaker. 1 QUESTIONS 1. Describe and sketch any water motion you see. 2. Explain why this motion occurs. 3. If your explanation for #2 above is correct, where should the water be warmer, at the very bottom of the beaker or near the middle of the beaker? Explain the reasoning behind your answer. 4. Applying your observations of this model to the real atmosphere, the troposphere generally undergoes convection / does not undergo convection because it is heated from above / below (Circle the correct answers) PART B: ATMOSPHERIC MOISTURE Measurements of temperature and humidity conditions are fundamental to our understanding of, and ability to predict, atmospheric processes and effects. In this lab you will investigate several aspects of atmospheric moisture: Water vapour capacity of air Relative Humidity – wet and dry bulb temperatures and calculation of R.H. Dew Point Temperature and Condensation 2 You will use the skills in reading relevant graphs and tables, from 1-3 above, to track the temperature and the relative humidity of an air parcel that moves through various elevations, which you can do if you know its initial temperature and absolute humidity and the topography of the landscape it crosses. PART C: WATER VAPOUR CAPACITY OF AIR Humidity is a measure of the amount of water vapour in the air. The amount of water vapour required for saturation is a function of the air temperature, which can change both at a location and as air changes location. The mass of water vapour in the air compared to the mass of dry air is referred to as the mixing ratio. The total amount of vapor that air can hold at any given temperature, by weight relationship, is referred to as the saturation mixing ratio. Saturation is generally defined as the condition where any addition of water vapor to a mass of air leads to the condensation of liquid water (or the deposition of ice) at a given T and P. Table 1 gives data of saturation mixing ratios of air versus temperature. To better visualize the data, plot the data on Figure 1. Figure 1 Table 1: Saturation mixing ratio (at 1000 mb). Temperature Degrees Celsius Vapor (g) per Kilogram of Dry Air 50 88.12 40 49.81 30 27.69 20 14.85 10 7.76 0 3.84 0 10 Temperature 3 20 30 40 50 Use the data from Table 1 or your graph to find the water vapour content at saturation for 1kg of air at the following temperatures: 0oC: _________g/kg 25oC : _______g/kg -10oC:________g/kg Another useful measurement is the quantity of water in air at saturation (Saturation Quantity). Use Figure 2 to give the saturation quantity (grams per cubic meter) for a mass of air having a temperature of: 35°C __________g/m3 25°C __________g/m3 20°C __________g/m3 0°C __________g/m3 -10°C _________ g/m3 4 Figure 2: Saturation Quantity and Dew Point Chart PART B: RELATIVE HUMIDITY The most commonly used measure of humidity is relative humidity. It can be simply defined as the amount of water in the air relative to the saturation amount the air can hold at a given temperature multiplied by 100. For example, air with a relative humidity of 50% contains half the water vapor it could hold at saturation at any particular temperature. The relative humidity can be found by using a psychrometer (two thermometers) and a chart. One of the thermometers measures the air temperature. This is the dry-bulb reading. The other thermometer has a wet wick on the bottom of the bulb. Water evaporating from the wick into the air takes energy with it, cooling off the thermometer. As the relative humidity increases, less water can evaporate into the air. This makes the temperature readings between the two thermometers closer. The difference between the wet and dry-bulb temperatures is called the wet-bulb depression. The wet-bulb temperature is always lower than or the same as the dry -bulb temperature. If the temperatures are the same, the relative humidity is 100 percent. The wet-bulb depression is used with the dry-bulb temperature and a chart to determine the relative humidity. Table 2 shows this chart. 5 TABLE 2 Chart for Determining Relative Humidity (%) Use Table 2 to find the relative humidity for each of the pairs of psychrometer readings: Reading 1 Reading 2 Reading 3 Dry bulb temperature 20oC 32oC -4 oC Wet bulb temperature 18oC 25oC -8 oC Difference ______ ______ _______ R. H. ______% ______% _______% What do you notice about the range in relative humidities at very low temperatures versus at higher temperatures? 6 PART D: DEW POINT AND CONDENSATION The temperature at which water vapor condenses into liquid water is called the dew point . If the dew point is below 0°C, it is called the frost point . These are important numbers in helping to determine where to post frost warnings. The dew-point temperature is found in a similar manner to that of relative humidity. The dry-bulb and wet-bulb temperatures are determined. The wet-bulb depression and dry-bulb temperature are used with the chart in Table 3 to find the dew point. TABLE 3 Chart for Determining Dew-point Temperature (°C) Use Table 3 to determine the dew point temperature for each of the following pairs of psychrometer readings: Reading 1 Reading 2 Reading 3 Dry bulb temperature 8oC 30oC -4oC Wet bulb temperature 6oC 24oC -8oC Difference ______ ______ _______ Dew point temperature ______ oC ______ oC _______ oC 7 PART E: REAL WORLD APPLICATION In the real world, air parcels have properties, such as temperature, pressure and humidity, which are measurable at a given place and time. As the air parcel moves, horizontally and vertically, these properties will change with the environment. When air rises and experiences a decrease in pressure, it expands and cools, whereas descending air is compressed and its temperature rises. Such temperature changes caused by expansion or compression are called adiabatic temperature changes. Air with a temperature above its dew point (unsaturated air) warms or cools at the dry adiabatic rate of 10oC per 1000m. Rising saturated air cools at the wet adiabatic rate with an average of about 5oC per 1000m. This exercise will require the methods developed above to work out what will happen to an air mass as it crosses a mountain and valley system, such as happens in a westerly air flow from the BC coast toward the Interior. PROCEDURE You are given the initial conditions of absolute humidity (mass of water vapor, in grams, per unit volume of dry air, in cubic meters) and temperature (see exercise below). Knowing these facts about the air mass, you will work out the maximum amount of water vapor (the saturation quantity) it could potentially hold at the start of the cross-section (from knowing its temperature and then consulting Figure 2). Once you know the saturation quantity, you can compare the actual absolute humidity with this maximum, in order to calculate its relative humidity at the beginning. Knowing its actual absolute humidity, you can work out its dew point temperature, again by consulting Figure 2. Once you know its initial dew point temperature, you can then determine its saturation condensation level (SCL or dew point elevation). You do this by subtracting the dew point temperature from the starting temperature and then dividing your answer by the dry adiabatic lapse rate. Once you know the SCL, you know that the air will cool at the dry adiabatic lapse rate up until that elevation and then will switch to the wet adiabatic lapse rate above that elevation (as long as the air is rising: descending air always warms at the dry rate). You will then be able to determine the temperature at the highest point: Subtract the SCL from the highest elevation Multiply that answer by the wet adiabatic lapse rate Then subtract that answer from the dew point temperature. Work out the absolute humidity for the highest elevation. Remember that the actual absolute humidity cannot be greater than the saturation quantity for the coldest temperature (the temperature that can hold the least water vapor). You can calculate the temperature at the end by: multiplying the kilometers of descent times the dry rate and then 8 adding the answer to the cold temperature at the top of the tallest peak. Look up the saturation quantity for the temperature at the end. Since you know the absolute humidity left in the air after its ascent to the highest point in the cross-section and since you also know the saturation quantity at the end of the cross section, you are now in a position to calculate the relative humidity at the end. A useful formula for relative humidity is RH = AH x 100/S, where: RH = Relative humidity (what you're trying to find) AH = Absolute humidity (what you're given at A or what's left over in the air mass at D) S = Saturation quantity for air at a particular temperature (here, at E) In the last section, summarize why there is such a difference in temperature and relative humidity from the beginning to the end. Think about what latent heat is and what it has to do with water's phase changes. STARTING CONDITIONS A mass of air has an initial temperature of 35°C and an absolute humidity of 9 g/m3. It blows over a terrain having the cross section shown in Figure 3. QUESTIONS 1. What is its relative humidity at the beginning of its ascent? __________ % Show your calculation: 2. What is the dew point for this parcel of air? __________°C 3. At which elevation will the air reach dew point? In other words, what is the saturation condensation level? __________ km Show your calculation: 4. Will it rain on slope A-B? _____yes _____no Explain: 5. Will it rain on slope B-C? _____yes _____no Explain: 9 6. Will it rain on slope C-D? _____yes _____no Explain: 7. Will it rain on slope D-E? _____yes _____no Explain: 8. What will the temperature be at the highest point in the cross-section? __________°C Show your calculation: 9. What is the new dew point and the new absolute humidity for this air? __________°C and __________g/m3 10. Why does there have to be a new dew point and absolute humidity? 11. What will the temperature be at E? __________°C Show your calculation: 12. What will the relative humidity be at E? __________°C Show your calculation: 13. Why is the temperature so much greater at E than it was when it started out at A? 14. Why is the relative humidity at E so much lower? 15. How high would a third mountain range to the right of E have to be to experience any precipitation from this particular air mass? 10 11
