Additional file 1: Figure S1.
advertisement
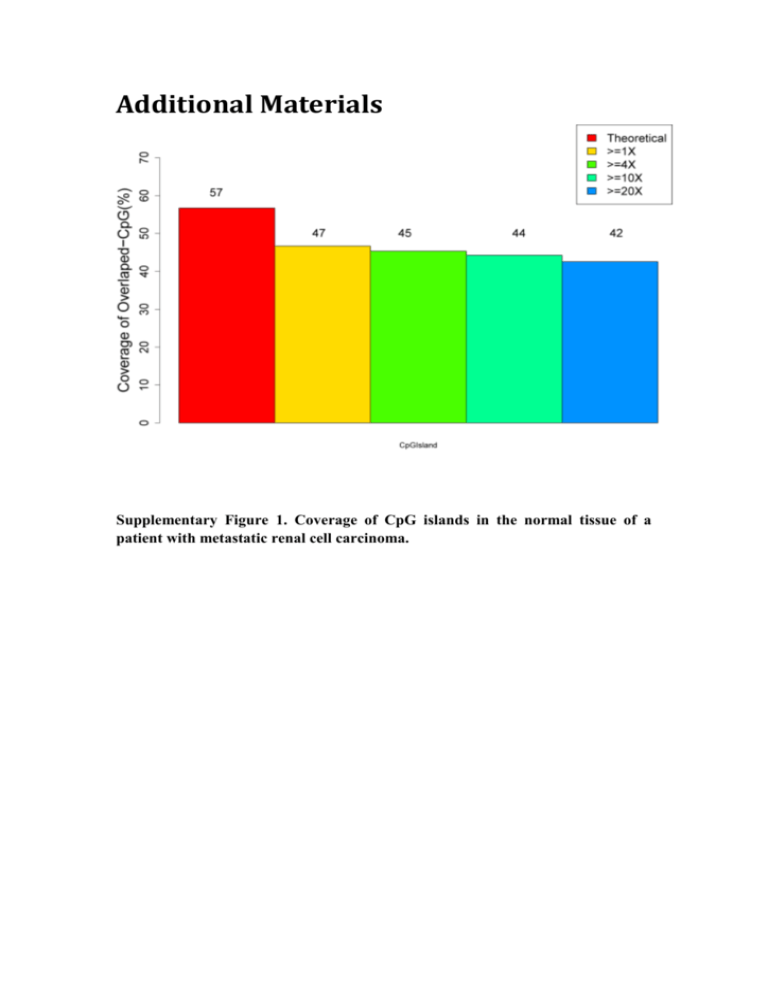
Additional Materials Supplementary Figure 1. Coverage of CpG islands in the normal tissue of a patient with metastatic renal cell carcinoma. Supplementary Figure 2. Coverage of CpG islands in primary renal cell carcinoma (pRCC) tissue of a patient with metastatic renal cell carcinoma. Supplementary Figure 3. Coverage of CpG islands in local invasion of the vena cava (IVC) tissue of a patient with metastatic renal cell carcinoma. Supplementary Figure 4. Coverage of CpG islands in distant metastasis to the brain (MB) tissue of a patient with metastatic renal cell carcinoma. Supplementary Figure 5. Venn diagram showing how SNPs are shared in four real datasets. (a) Shared numbers of correctly estimated SNPs in different tissues using Bowtie2, Bismark and BSMAP pipelines. (b) Shared numbers of correctly estimated SNPs detected by two pipelines in four tissues. Supplementary Figure 6. Venn diagram showing how SNPs are shared in BSMAP and Bismark pipelines. (a) PE50 data in silico. (b) PE90 data in silico. Supplementary Table 1. Comparison of analytical features of programs for evaluation of genome-wide methylation data.* Input file format(s) Feature(s) BIGpre [1] FASTQ A BSeQC [2] SAM, BAM A Tab-delimited text, R file (for plotting) SAM, BAM, PDF, text Fastqc [3] FASTQ A HTML report HTQC [4] FASTQ A Toolkit [5] FASTQ A PIQA [6, 7] QC-Chain SolexaQA [7] RUbioSeq [8] FASTQ FASTQ FASTQ FASTQ A A A A, B, C WBSA [9] FASTQ A, B , C, E, F, G BRAT [10] FASTQ B Software BRAT-BW [11, FASTQ 12] BSMAP [12] FASTQ, BAM B B BS-Seeker [13] FASTQ B GSNAP [14] SOAP [15] BatMeth [16] Bismark [17] FASTQ FASTA FASTQ FASTQ B B B, C B, C BS-Seeker2 [18] FASTQ B, C MethylCoder [19] MethyQA [20] PASS-bis [21] FASTQ FASTQ FASTQ FASTQ, BAM, SAM Bismark output (.bis) Bismark output, text BSP, BS-Seeker B, C B, C B, C MethPipe [22] DMEAS [20] CpG_MPs [23] GBSA [24] Output file format(s) Program type Command line (Perl) Command line (Python) GUI (Java), Command line (Java) Command line (C++) FASTQ, tab-delimited text FASTQ, HTML report, Command line (R library) tab-delimited text HTML report Command line (R library) FASTQ Command line (binary, C++) FASTQ, PDF, text Command line (Perl, R library) SAM/BAM, bed, wig, VCF Command line (Perl) SAM, HTML report, tab-delimited text, genome Web server browser Tab-delimited text Command line (C++) (convertible to SAM) Tab-delimited text Command line (C++) (convertible to SAM) SAM/BAM, BSP, text Command line (C++) SAM/BAM, tab-delimited Command line (Python) text SAM Command line (C/Perl) Tab-delimited text, SAM Command line (C++) Custom text format, PDF Command line (C/C++) SAM, tab-delimited text Command line (Perl) SAM/BAM, tab-delimited Command line (Python) text, wig SAM, tab-delimited text Command line (Python) Tab-delimited text Command line (C++) Modified SAM Command line (C++) B, C, G, Ia BAM, tab-delimited text Command line (C++) C, D, E Tab-delimited text, images Command line (Perl) C, D, E, G C, E, F Tab-delimited text, xls, images, genome browser Bedgraph, tab-delimited Java applet GUI (Windows), Command (text) MethylKit [25] Tab-delimited text Bismark ouput UCSC Genome BAM, bedgraph, Bowser [26] VCF, wig Whitespace-delimi VEP [27] ted, VCF Bis-SNP [28] BAM DMAP [29] Bismark ouput SMAP FASTQ C, E, F, G text, images, gene browser Bedgraph, tab-delimited text, images E Genome browser F Tab-delimited text, VCF C, H C,E,F,G A, B, C, E, F, G, H, Ib, J Tab-delimited text, VCF Tab-delimited text Tab-delimited text, VCF, images line (Python) Command line (R library) Web server Web server, Command line (Perl) Java applet Command line (C++) GUI (Linux), Command line (Perl, R) *We integrated Table 1 in [30] and added our work in this table. A: QC; B: alignment; C: methylation scoring; D: quantitative score assessment; E: visualization; F: annotation; G: determination of differential DNA methylation; H: SNP detection; Ia: ASM analysis (using Amrfinder); Ib: ASM analysis (based on heterozygous SNPs); J: PE overlap treatment. Supplementary Table 2. The comparison of mapping performance between BSMAP and Bismark in silico. BSMAP # total reads MR AMR Bismark FPR FNR MR AMR FPR FNR PE50 276760 276538 219886 0.21 0 238608 233541 0.02 0.14 PE60 276760 276640 239210 0.13 0 248555 246072 0.01 0.1 PE70 276760 276760 250853 0.09 0 253610 251645 0.01 0.08 PE80 276760 276760 258141 0.07 0 254470 252880 0.01 0.08 PE90 276760 276760 262228 0.05 0 250525 249473 0 0.09 Abbreviations: MR: the number of mapped reads; AMR: the number of accurately mapped reads; FPR: false-positive rate; FNR: false-negative rate. Supplementary Table 3. The performance of methylation detection in silico. Theoretical Estimated values values Start:End Rm (C) Rm (N) Rm Rm Rm Rm Rm Rm Rm Rm (C50T) (N50T) (C90T) (N90T) (C90M) (N50M) (C90M) (N90M) 10840:7173856 0.1 0.1 0.11 0.10 0.11 0.09 0.12 0.11 0.11 0.10 7174993:12377197 1 0 1.00 0.00 1.00 0.00 1.00 0.00 1.00 0.00 12377258:19791219 0 1 0.00 1.00 0.00 1.00 0.00 1.00 0.00 1.00 19793485:30349690 0.5 0.1 0.50 0.10 0.50 0.10 0.52 0.11 0.51 0.10 30350542:43963808 0.1 0.5 0.09 0.49 0.10 0.49 0.09 0.50 0.10 0.50 43969498:49866894 0.7 0.3 0.69 0.30 0.70 0.30 0.70 0.31 0.70 0.30 49972394:59634023 0.3 0.7 0.30 0.70 0.31 0.71 0.31 0.71 0.31 0.72 59647120:72163528 0.1 0.5 0.10 0.49 0.10 0.50 0.11 0.52 0.10 0.51 72164007:76469542 0.5 0.1 0.50 0.09 0.50 0.10 0.51 0.10 0.50 0.10 76473832:77971764 0.5 0.5 0.50 0.50 0.50 0.50 0.50 0.50 0.49 0.50 Abbreviations: Rm: methylation rate; C: Cancer; N: Normal; 50: PE50; 90: PE90; T: Bismark/Bowtie2; M: BSMAP. Supplementary Table 4. The validation of DMR in primary renal cell carcinomas (pRCC) and Normal tissues. Gene Sample #All CpGs #uCpG #mCpG Rm (%) C 484 358 126 26.0 N 588 545 43 7.3 C 229 111 118 51.5 N 185 174 11 5.9 C 407 271 136 33.4 N 134 122 12 9.0 C 59 31 28 47.5 N 123 101 22 17.9 C 128 51 77 60.2 N 304 247 57 18.8 C 308 228 80 26.0 N 308 276 32 10.5 C 199 134 65 32.7 N 299 254 45 15.1 C 221 132 89 40.3 N 419 367 52 12.4 SLC5A7 CD01 CRMP1 ALX1 TBC1D1 MAL DES DDX25 p value Validated? Target region 2.15E-12 Yes chr2:107969359:107969444 1.82E-13 Yes chr5:115180214:115180511 1.86E-05 Yes chr4:5943104:5943228 0.003903 T chr12:84197456:84197648 8.74E-09 Yes chr4:37568194:37568432 4.54E-05 Yes chr2:95054506:95054901 3.75E-04 Yes chr2:219991376:219991474 6.17E-10 Yes chr11:125279592:125279697 C 605 443 162 26.8 N 203 186 17 8.4 C 352 297 55 15.6 N 416 245 171 41.1 C 108 78 30 27.8 N 119 104 15 12.6 C 348 189 159 45.7 N 348 295 53 15.2 USP44 PRIMA1 ZNF177 C9orf75 8.75E-06 Yes chr12:94466217:94466921 1.20E-08 Yes chr14:93323531:93323906 0.0295 Yes chr19:9334684:9334856 2.32E-10 Yes chr9:139213596:139214223 Abbreviations: C: Cancer, N: Normal; Rm: methylation rate; uCpG: Unmethylated CpGs; mCpG: Methylated CpGs. Supplementary Table 5. Comparison of the performance of BSMAP, Bismark and Bowtie2 pipelines with real data. BSMAP + Bis-SNP MB IVC Bismark + Bis-SNP pRCC Normal MB IVC pRCC Normal Bowtie2 + Bcftools MB IVC pRCC Normal # Exon SNPs* 2966 2995 3401 2873 2827 2839 2931 2786 2375 2502 2528 2513 # Target SNPs 4355 3906 3308 3483 1404 1151 844 1268 3258 3353 2924 3137 2011 1346 1108 816 1233 1702 1705 1821 1764 # SNPs validated 2176 2145 2195 FPR 0.5 0.45 0.34 0.42 0.04 0.04 0.03 0.03 0.48 0.49 0.38 0.44 FNR 0.27 0.28 0.35 0.3 0.52 0.61 0.72 0.56 0.28 0.32 0.28 0.30 *Whole exome-sequenced data were used to validate overlapped target SNPs in RRBS regions and exome target regions. Abbreviations: FPR: false-positive rate; FNR: false-negative rate; Target: overlap of exome target regions and RRBS target regions. Normal: normal tissue; pRCC: primary renal cell carcinomas; IVC: local invasion of the vena cava; MB: distant metastasis to the brain; Exon SNPs: SNPs detected in exon target regions; Target SNPs: SNPs detected in target regions. References 1. 2. Zhang T, Luo Y, Liu K, Pan L, Zhang B, Yu J, Hu S. BIGpre: a quality assessment package for next-generation sequencing data. Genomics, Proteomics Bioinformatics. 2011;9:238-44. Lin X, Sun D, Rodriguez B, Zhao Q, Sun H, Zhang Y, Li W. BSeQC: quality 3. 4. 5. 6. 7. 8. 9. 10. 11. 12. 13. 14. 15. 16. 17. 18. 19. control of bisulfite sequencing experiments. Bioinformatics. 2013; 29:3227-9. S. A. FastQC: a quality control tool for high throughput sequence data. http://wwwbioinformaticsbabrahamacuk/projects/fastqc/ (Accessed 14 April 2014). Yang X, Liu D, Liu F, Wu J, Zou J, Xiao X, Zhao F, Zhu B. HTQC: a fast quality control toolkit for Illumina sequencing data. BMC Bioinform. 2013;14:33. Patel RK, Jain M. NGS QC Toolkit: a toolkit for quality control of next generation sequencing data. PloS One. 2012;7:e30619. Martinez-Alcantara A, Ballesteros E, Feng C, Rojas M, Koshinsky H, Fofanov VY, Havlak P, Fofanov Y. PIQA: pipeline for Illumina G1 genome analyzer data quality assessment. Bioinformatics. 2009;25:2438-9. Cox MP, Peterson DA, Biggs PJ. SolexaQA: At-a-glance quality assessment of Illumina second-generation sequencing data. BMC Bioinformatics. 2010;11:485. Rubio-Camarillo M, Gomez-Lopez G, Fernandez JM, Valencia A, Pisano DG. RUbioSeq: a suite of parallelized pipelines to automate exome variation and bisulfite-seq analyses. Bioinformatics. 2013;29:1687-9. Liang F, Tang B, Wang Y, Wang J, Yu C, Chen X, Zhu J, Yan J, Zhao W, Li R. WBSA: web service for bisulfite sequencing data analysis. PloS One.2014;9:e86707. Harris EY, Ponts N, Levchuk A, Roch KL, Lonardi S. BRAT: bisulfite-treated reads analysis tool. Bioinformatics. 2010;26:572-3. Harris EY, Ponts N, Le Roch KG, Lonardi S. BRAT-BW: efficient and accurate mapping of bisulfite-treated reads. Bioinformatics. 2012;28:1795-6. Xi Y, Li W. BSMAP: whole genome bisulfite sequence MAPping program. BMC Bioinform 2009;10:232. Chen PY, Cokus SJ, Pellegrini M. BS Seeker: precise mapping for bisulfite sequencing. BMC Bioinform 2010;11:203. Wu TD, Nacu S. Fast and SNP-tolerant detection of complex variants and splicing in short reads. Bioinformatics. 2010;26:873-81. Li R, Li Y, Kristiansen K, Wang J. SOAP: short oligonucleotide alignment program. Bioinformatics. 2008;24:713-14. Lim JQ, Tennakoon C, Li G, Wong E, Ruan Y, Wei CL, Sung WK. BatMeth: improved mapper for bisulfite sequencing reads on DNA methylation. Genome Biol. 2012;13:R82. Krueger F, Andrews SR. Bismark: a flexible aligner and methylation caller for Bisulfite-Seq applications. Bioinformatics. 2011;27(11):1571-2. Guo W, Fiziev P, Yan W, Cokus S, Sun X, Zhang MQ, Chen PY, Pellegrini M. BS-Seeker2: a versatile aligning pipeline for bisulfite sequencing data. BMC Genomics.2013;14:774. Pedersen B, Hsieh TF, Ibarra C, Fischer RL. MethylCoder: software pipeline for bisulfite-treated sequences. Bioinformatics. 2011;27:2435-6. 20. 21. 22. 23. 24. 25. 26. 27. 28. 29. 30. He J, Sun X, Shao X, Liang L, Xie H. DMEAS: DNA methylation entropy analysis software. Bioinformatics. 2013;29:2044-5. Campagna D, Telatin A, Forcato C, Vitulo N, Valle G. PASS-bis: a bisulfite aligner suitable for whole methylome analysis of Illumina and SOLiD reads. Bioinformatics. 2013;29:268-270. Song Q, Decato B, Hong EE, Zhou M, Fang F, Qu J, Garvin T, Kessler M, Zhou J, Smith AD. A reference methylome database and analysis pipeline to facilitate integrative and comparative epigenomics. PloS One. 2013;8:e81148. Su J, Yan H, Wei Y, Liu H, Liu H, Wang F, Lv J, Wu Q, Zhang Y. CpG_MPs: identification of CpG methylation patterns of genomic regions from high-throughput bisulfite sequencing data. Nucl Acids Res. 2013;41:e4. Benoukraf T, Wongphayak S, Hadi LH, Wu M, Soong R. GBSA: a comprehensive software for analysing whole genome bisulfite sequencing data. Nucl Acids Res. 2013;41:e55. Akalin A, Kormaksson M, Li S, Garrett-Bakelman FE, Figueroa ME, Melnick A, Mason CE. methylKit: a comprehensive R package for the analysis of genome-wide DNA methylation profiles. Genome Biol. 2012;13:R87. Meyer LR, Zweig AS, Hinrichs AS, et al. The UCSC Genome Browser database: extensions and updates 2013. Nucl Acids Res. 2013;41:D64-D69. McLaren W, Pritchard B, Rios D, Chen Y, Flicek P, Cunningham F. Deriving the consequences of genomic variants with the Ensembl API and SNP Effect Predictor. Bioinformatics. 2010;26:2069-70. Liu Y, Siegmund KD, Laird PW, Berman BP. Bis-SNP: Combined DNA methylation and SNP calling for Bisulfite-seq data. Genome Biol. 2012;13:R61. Stockwell PA, Chatterjee A, Rodger EJ, Morison IM. DMAP: differential methylation analysis package for RRBS and WGBS data. Bioinformatics. 2014; doi: 10.1093/bioinformatics/btu126. Adusumalli S, Mohd Omar MF, Soong R, Benoukraf T. Methodological aspects of whole-genome bisulfite sequencing analysis. Brief Bioinform. 2014; doi: 10.1093/bib/bbu016.
