Random Sampling distribution principles:
advertisement

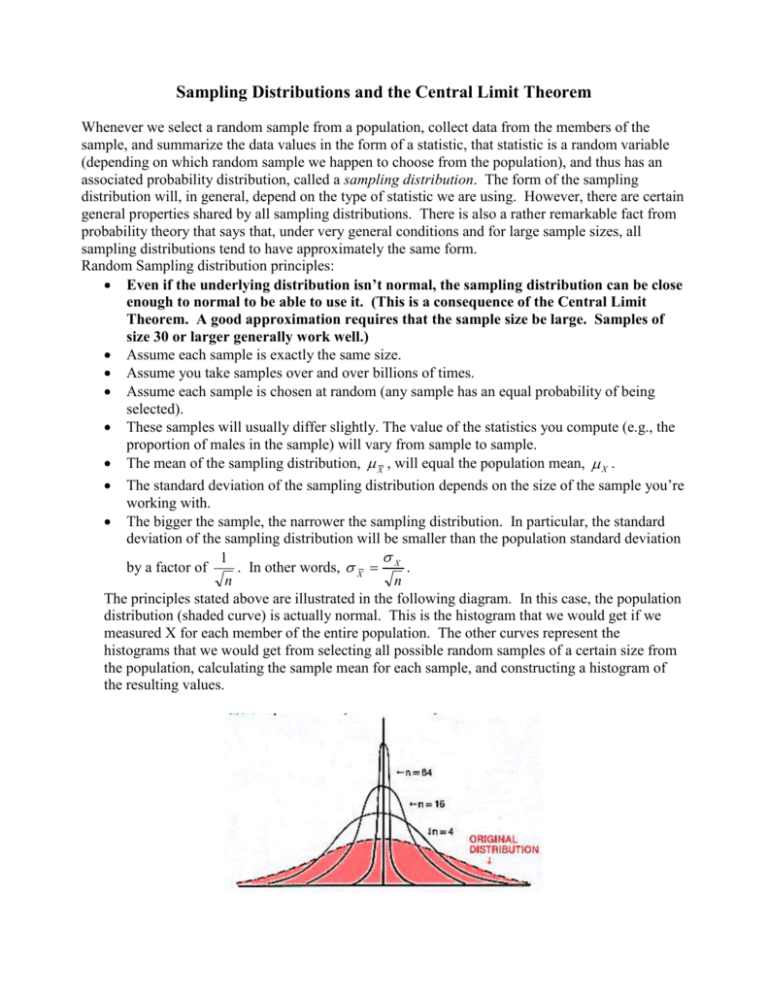
Sampling Distributions and the Central Limit Theorem Whenever we select a random sample from a population, collect data from the members of the sample, and summarize the data values in the form of a statistic, that statistic is a random variable (depending on which random sample we happen to choose from the population), and thus has an associated probability distribution, called a sampling distribution. The form of the sampling distribution will, in general, depend on the type of statistic we are using. However, there are certain general properties shared by all sampling distributions. There is also a rather remarkable fact from probability theory that says that, under very general conditions and for large sample sizes, all sampling distributions tend to have approximately the same form. Random Sampling distribution principles: Even if the underlying distribution isn’t normal, the sampling distribution can be close enough to normal to be able to use it. (This is a consequence of the Central Limit Theorem. A good approximation requires that the sample size be large. Samples of size 30 or larger generally work well.) Assume each sample is exactly the same size. Assume you take samples over and over billions of times. Assume each sample is chosen at random (any sample has an equal probability of being selected). These samples will usually differ slightly. The value of the statistics you compute (e.g., the proportion of males in the sample) will vary from sample to sample. The mean of the sampling distribution, X , will equal the population mean, X . The standard deviation of the sampling distribution depends on the size of the sample you’re working with. The bigger the sample, the narrower the sampling distribution. In particular, the standard deviation of the sampling distribution will be smaller than the population standard deviation 1 by a factor of . In other words, X X . n n The principles stated above are illustrated in the following diagram. In this case, the population distribution (shaded curve) is actually normal. This is the histogram that we would get if we measured X for each member of the entire population. The other curves represent the histograms that we would get from selecting all possible random samples of a certain size from the population, calculating the sample mean for each sample, and constructing a histogram of the resulting values.


