Grade 6 Unit 4 – Statistics and Probability
advertisement
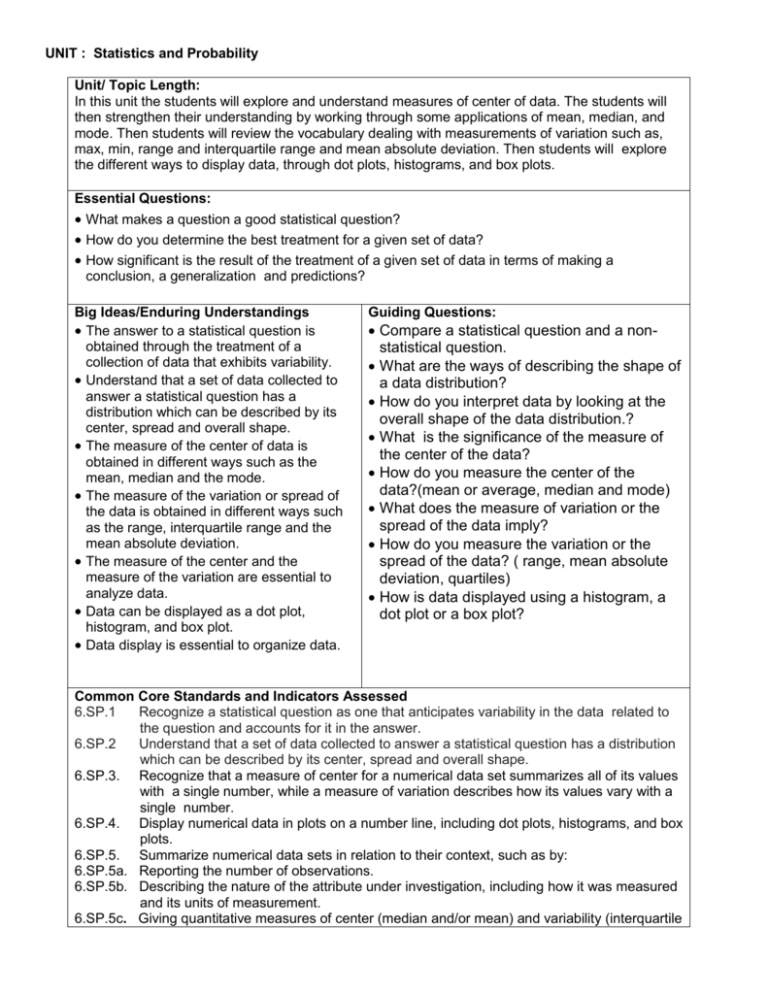
UNIT : Statistics and Probability Unit/ Topic Length: In this unit the students will explore and understand measures of center of data. The students will then strengthen their understanding by working through some applications of mean, median, and mode. Then students will review the vocabulary dealing with measurements of variation such as, max, min, range and interquartile range and mean absolute deviation. Then students will explore the different ways to display data, through dot plots, histograms, and box plots. Essential Questions: What makes a question a good statistical question? How do you determine the best treatment for a given set of data? How significant is the result of the treatment of a given set of data in terms of making a conclusion, a generalization and predictions? Big Ideas/Enduring Understandings The answer to a statistical question is obtained through the treatment of a collection of data that exhibits variability. Understand that a set of data collected to answer a statistical question has a distribution which can be described by its center, spread and overall shape. The measure of the center of data is obtained in different ways such as the mean, median and the mode. The measure of the variation or spread of the data is obtained in different ways such as the range, interquartile range and the mean absolute deviation. The measure of the center and the measure of the variation are essential to analyze data. Data can be displayed as a dot plot, histogram, and box plot. Data display is essential to organize data. Guiding Questions: Compare a statistical question and a nonstatistical question. What are the ways of describing the shape of a data distribution? How do you interpret data by looking at the overall shape of the data distribution.? What is the significance of the measure of the center of the data? How do you measure the center of the data?(mean or average, median and mode) What does the measure of variation or the spread of the data imply? How do you measure the variation or the spread of the data? ( range, mean absolute deviation, quartiles) How is data displayed using a histogram, a dot plot or a box plot? Common Core Standards and Indicators Assessed 6.SP.1 Recognize a statistical question as one that anticipates variability in the data related to the question and accounts for it in the answer. 6.SP.2 Understand that a set of data collected to answer a statistical question has a distribution which can be described by its center, spread and overall shape. 6.SP.3. Recognize that a measure of center for a numerical data set summarizes all of its values with a single number, while a measure of variation describes how its values vary with a single number. 6.SP.4. Display numerical data in plots on a number line, including dot plots, histograms, and box plots. 6.SP.5. Summarize numerical data sets in relation to their context, such as by: 6.SP.5a. Reporting the number of observations. 6.SP.5b. Describing the nature of the attribute under investigation, including how it was measured and its units of measurement. 6.SP.5c. Giving quantitative measures of center (median and/or mean) and variability (interquartile range and/or mean absolute deviation), as well as describing any overall pattern and any striking deviations from the overall pattern with reference to the context in which the data were gathered. 6.SP.5d. Relating the choice of measures of center and variability to the shape of the data distribution and the context in which the data were gathered. Content Prior Knowledge: Graphing coordinates Add, subtract, multiply, divide integers and decimals Arranging numbers according to a certain order Skills Identify statistical questions Contrast statistical and non-statistical questions. Define a statistical question as a question that allows for the gathering of variable data. Describe a set of data in terms of its center (mean, median), spread (range, interquartile range, mean absolute deviation), and overall shape. Define measure of center for a data set as the summary of all its values as one number. Define measure of variation for a data set as how the data varies as one number. Display numerical data as plots on a number line. Display numerical data as plots in a dot plot Display numerical data in a histogram. Display numerical data in a box plot (box-and-whisker plot). Record the number of observations within a numerical data set. Describe how a data set was measured and its units of measurement Calculate measures of center: median and/or mean. Calculate measures of variability: interquartile range and/or mean absolute deviation. Describe any overall patterns or deviations from the overall pattern in relation to the context of the data collection Compare and contrast the measures of center to the data distribution in the context of the data collection. Compare and contrast the measures of variability to the data distribution in the context of the data collection. Vocabulary/ Key Terms statistical question non-statistical question variability data Center Mean Median Spread Range quartile interquartile range mean absolute deviation overall shape measure of center measure of variation dot plot histogram box plot number line observations data set units of measurement biased unbiased overall pattern measures of center measures of variability data distribution context of data collection ASSESSMENT EVIDENCE Authentic Performance Task(s): Alignment to Common Core Standards for Mathematics: Statistical and Non-statistical Questions ( New York Ready textbook) 6.SP.1 Recognize a statistical question as one that anticipates variability in the data related to the question and accounts for it in the answer. Ann’s Chickens (From Boces) 6.SP.5 Summarize numerical data in relation to their context by giving quantitative measures of center and variability as well as overall pattern and deviations from such pattern. Writing Scores of 6th Graders on Sentence Structure (From Boces) 6.SP.3 6.SP.4 Recgnize the difference between the measure of center and the measure of variation. Display numerical data on a number line, including dot plots, histograms and box plots. Math Standards for Practice 1. Make sense of problems and persevere in solving them. 2. Reason abstractly and quantitatively. 3. Model with mathematics. 4. Use appropriate tools strategically. 5. Attend to precision. Formative Assessments: 1. Discussions 2. Reflections at the end of class 3. Homework Summative Assessments: 1. Quiz (graded) 2. Performance Task Teaching and Learning Activities: 1. 2. 3. 4. 5. Introduce unit vocabulary and integrate vocabulary into unit to learn the words. Use unit guiding questions Have students complete performance task for the unit. Use essential question as a post-assessment. Administer the unit test. Resources Needed: Math Curriculum, Impact Math, Math Review Handbook, NYSR – Grade 6
