An Introduction to Hierarchical Linear Modeling
advertisement
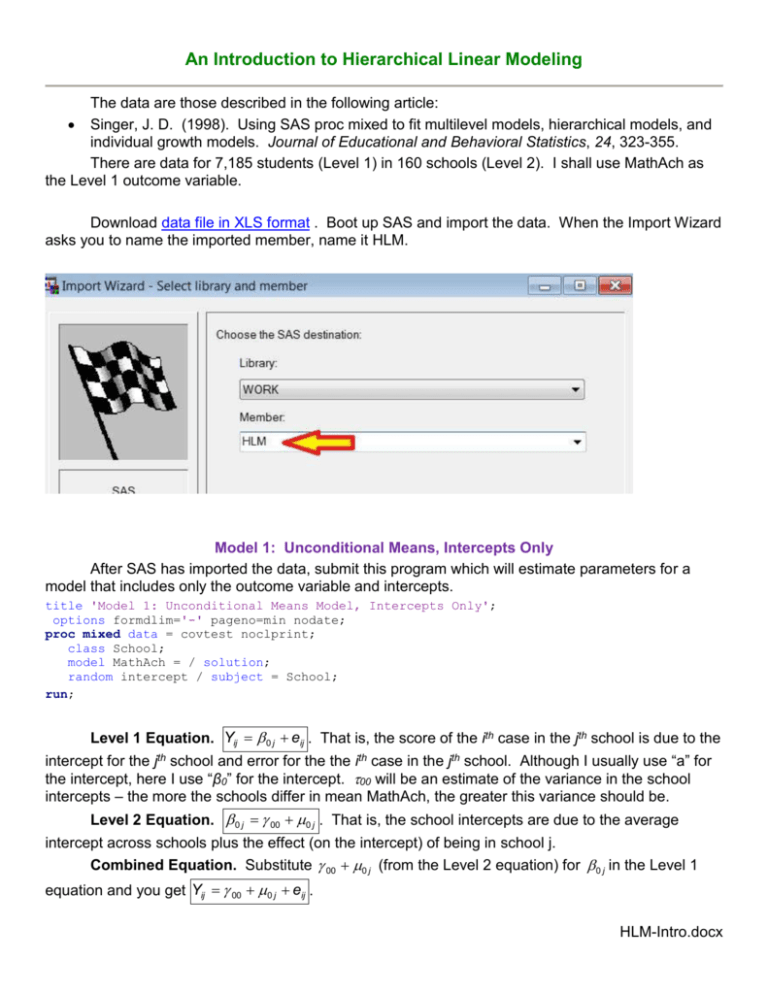
An Introduction to Hierarchical Linear Modeling The data are those described in the following article: Singer, J. D. (1998). Using SAS proc mixed to fit multilevel models, hierarchical models, and individual growth models. Journal of Educational and Behavioral Statistics, 24, 323-355. There are data for 7,185 students (Level 1) in 160 schools (Level 2). I shall use MathAch as the Level 1 outcome variable. Download data file in XLS format . Boot up SAS and import the data. When the Import Wizard asks you to name the imported member, name it HLM. Model 1: Unconditional Means, Intercepts Only After SAS has imported the data, submit this program which will estimate parameters for a model that includes only the outcome variable and intercepts. title 'Model 1: Unconditional Means Model, Intercepts Only'; options formdlim='-' pageno=min nodate; proc mixed data = covtest noclprint; class School; model MathAch = / solution; random intercept / subject = School; run; Level 1 Equation. Yij 0 j eij . That is, the score of the ith case in the jth school is due to the intercept for the jth school and error for the the ith case in the jth school. Although I usually use “a” for the intercept, here I use “β0” for the intercept. 00 will be an estimate of the variance in the school intercepts – the more the schools differ in mean MathAch, the greater this variance should be. Level 2 Equation. 0 j 00 0 j . That is, the school intercepts are due to the average intercept across schools plus the effect (on the intercept) of being in school j. Combined Equation. Substitute 00 0 j (from the Level 2 equation) for 0 j in the Level 1 equation and you get Yij 00 0 j eij . HLM-Intro.docx 2 Fixed Effects. These are effects that are constant across schools. They are specified in the model statement (see the SAS code above). Since no variable follows the “=” sign in “model MathAch =/”, the only fixed parameter is the average intercept across schools, which SAS automatically includes in the model. This effect is symbolized with “ 00 ” in the boxed equations. Remember that the outcome variable is MathAch. Random Effects. These are effects that vary across schools, 0j and eij. I shall estimate their variance. Look at the Output. Under “Solution for Fixed Effects” we find an estimate of the average intercept across schools, 12.637. That it differs significantly from zero is of no interest (unless zero is a meaningful point on the scale of the outcome variable). Under “Covariance Parameter Estimates,” the Random Effects, you see that the variance in intercepts across schools is estimated to be 8.6097 and it is significantly greater than zero (this is a one-tailed test, since a variance cannot be less than 0 unless you have been drinking too much). This tells us that the schools differ significantly in intercepts (means). The error variance (differences among students within schools) is estimated to be 39.1487, also significantly greater than zero. Intraclass Correlation. We can use this coefficient to estimate the proportion of the variance in MathAch that is due to differences among schools. To get this coefficient we simply take the estimated variance due to schools and divide by the sum of that same variance plus the error variance, that is, 8.6097 / (8.6097 + 39.1487) = 18%. Model 2: Including a Level 2 Predictor in the Model I shall use MeanSES (the mean SES by school) as a predictor of MathAch. MeanSES has been centered/transformed to have a mean of zero (by subtracting the grand mean from each score). Level 1 Equation. Same as before. Level 2 Equation. 0 j 00 01MeanSES j 0 j . That is, the school intercepts/means are due to the average intercept across schools, the effect of being in a school with the MeanSES of school j, and the effect of everything else (error, extraneous variables) on which school j differs from the other schools. Combined Equation. Substituting the right hand side of the Level 2 equation into the Level 1 equation, we get Yij [ 00 01MeanSES j ] [ 0 j e ij ] . The parameters within the brackets on the left are fixed, those on the right are random. SAS Code. Add this code to your program and submit it (highlight just this code before you click the running person). title 'Model 2: Including Effects of School (Level 2) Predictors'; title2 '-- predicting MathAch from MeanSES'; run; proc mixed covtest noclprint; class school; model MathAch = MeanSES / solution ddfm = bw; random intercept / subject = school; run; Notice the addition of “ddfm = bw;”. This results in SAS using the “between/within” method of computing denominator df for tests of fixed effects. Why do this – because Singer says so. Look at the Output, Fixed Effects. Under “Solution for Fixed Effects,” we see that the equation for predicting MathAch is 12.6495 + 5.8635*(School MeanSES – Grand MeanSES) – remember that MeanSES is centered about zero. That is, for each one point increase in a school’s 3 MeanSES, MathAch rises by 5.9 points. For a school with average MeanSES, the predicted MathACH would be the intercept, 12.6. Grab your calculator and divide the estimated slope for MeanSES by its standard error, retaining all decimal points. Square the resulting value of t. You will get the value of F reported under “Type 3 Tests of Fixed Effects.” Notice that the df for the fixed effect of MeanSES = 158 (number of schools minus 2). Without the “ddfm = bw” the df would have been 7025. The t distribution is not much different with 7025 df than with 158 df, so this really would not have much mattered. Look at the Output, Random Effects. The value of the covariance parameter estimate for the (error) variance within schools has changed little, but that for the difference in intercepts/means across schools has decreased dramatically, from 8.6097 to 2.6357, a reduction of 5.974. That is, MeanSES explains 5.974/8.6097 = 69% of the differences among schools in MathAch. Even after accounting for variance explained by MeanSES, the MathAch scores differ significantly across schools (z = 6.53). Our estimate of this residual variance is 2.6357. Add to that our estimate of (error) variance among students within schools (39.1578) and we have 41.7935 units of variance not yet explained. Of that not yet explained variance, 2.6357/41.7935 = 6.3% remains available to be explained by some other (not yet introduced into the model) Level 2 predictor. Clearly most of the variance not yet explained is within schools, that is, at Level 1 – so lets introduce a Level 1 predictor in our next model. Model 3: Including a Level 1 Predictor in the Model Suppose that instead of entering MeanSES into the model I entered SES, the socio-economicstatus of individual students. Level 1 Equation. Yij 0 j 1 j SESij eij . That is, a student’s score is due to the intercept/mean for his/her school, the within-school effect of SES (these slopes may differ across schools), and error. To facilitate interpretation, I shall subtract from each student’s SES score the mean SES score for the school in which that student is enrolled. Thus, Yij 0 j 1j (SESij MSES j ) eij . In the SAS code this centered SES is represented by the variable “cSES.” Level 2 Equations. Each random effect (excepting error within schools) will require a separate Level 2 equation. Here I need one for the random intercept and one for the random slope. For the random intercept, 0 j 00 0 j . That is, the intercept for school j is the sum of the grand intercept across schools and the effect (on intercept) of being in school j. For the random slope, 1 j 10 1 j . That is, the slope for predicting MathAch from SES is, in school j, the grand slope (across all groups) and the effect (on slope) of being in school j. Combined Equation. Substituting the right hand expressions in the Level 2 equations for the corresponding elements in the Level 1 equation yields Yij [ 00 10 (SESij McSES j ) eij ] [ 0 j 1j (SESij MSES j ) eij ] . The fixed effects are within the brackets on the left, the random effects to the right. SAS Code. Add this code to your program and submit it. title 'Model 3: Including Effects of Student-Level Predictors'; title2 '--predicting MathAch from cSES'; data HLM2; set HLM; run; cSES = SES - MeanSES; 4 proc mixed data = hsbc noclprint covtest noitprint; class School; model MathAch = cSES / solution ddfm = bw notest; random intercept cSES / subject = School type = un; run; Note the computation of cSES, student SES centered about the mean SES for the student’s school. Just as “noclprint” suppresses the printing of class information, “noitprint” suppresses printing of information about the iterations. “Type = un” indicates you are imposing no structure, allowing all parameters to be determined by the data. Look at the Output, Fixed Effects. Under “Solution for Fixed Effects,” see that the estimated MathAch for a student whose SES is average for his or her school is 12.6493. The average slope, across schools, for predicting MathAch from SES is 2.1932, which is significantly different from zero. Look at the Output, Random Effects. Under “Covariance Parameter Estimates” we see that the “UN(1,1)” estimate is 8.6769 and is significantly greater than zero. This is an estimate of the variance (across schools) for the first parameter, the intercept. That it is significantly greater than zero tells us that there remains variance, across schools, in MathAch, even after controlling for cSES. The UN(2,1) estimates the covariance between the first parameter and the second, that is, between the school intercepts and school slopes. This (with a two-tailed test) falls well short of significance. There is no evidence that the slope for predicting MathAch from cSES depends on a school’s average value of MathAch. The UN(2,2) estimates the variance in the second parameter, cSES. The estimated variance, .694, is significantly greater than zero. In other words, the slope for predicting MathAch from cSES differs across schools. The unconditional means model (the first model) estimated the within-schools variance in MathAch to be 39.1487. Our most recent model shows that within-schools variance is 36.7006 after taking out the effect of cSES. Accordingly, cSES accounted for 39.1487-36.7006 – 2.4481 units of variance, or 2.4881/39.1487 = 6.25% of the within-school variance. Model 4: A Model with Predictors at Both Levels and All Interactions Here I add to the model the variable sector, where 0 = public school and 1 = Catholic school. Notice in the SAS code that the model also includes interactions among predictors. More on this later. SAS Code. title 'Model 4: Model with Predictors From Both Levels and Interactions'; proc mixed noclprint covtest noitprint; class School; model mathach = MeanSES sector cSES MeanSES*Sector MeanSES*cSES Sector*cSES MeanSES*Sector*cSES / solution ddfm = bw notest; random intercept cSES / subject = School type = un; run; Look at the Output, Fixed Effects. MeanSES x Sector and MeanSES x Sector x cSES are not significant. Without further comment I shall drop these from the model. Model 5: A Model with Predictors at Both Levels and Selected Interactions I provide more comment on this model. Level 1 Equation. Yij 0 j 1 j cSES eij . 5 Level 2 Equations. For the random intercept, 0 j 00 01MeanSESj 02Sector j 0 j . That is, the intercept/mean for a school’s MathAch is due to the grand mean, the effect of MeanSES, the effect of Sector, and the effect of being in school j. For the random slope, 1 j 10 11MeanSESj 12Sector j 1 j . That is, the slope for predicting MathAch from SES, in school j, is affected by the grand slope (across all schools), the effect of being in a school with the MeanSES that school j has, the effect of being in Catholic school, and the effect of everything else on which the schools differ. Combined Equation. Yij [ 00 01MeanSESj 02Sector j 10 cSES 11MeanSESj cSES j 12Sector j cSES j ] [ 0 j 1 j cSES j eij ] . Aren’t you glad you remember that algebra you learned in ninth grade? SAS Code. Add this code to your program and submit it title 'Model 5: Model with Two Interactions Deleted'; title2 '--predicting mathach from meanses, sector, cses and '; title3 'cross level interaction of meanses and sector with cses'; run; proc mixed noclprint covtest noitprint; class School; model MathAch = MeanSES Sector cSES MeanSES*cSES Sector*cSES / solution ddfm = bw notest; random intercept cSES / subject = School type = un; proc means mean q1 q3 min max skewness kurtosis; var MeanSES Sector cSES; run; Look at the Output, Fixed Effects. All of the fixed effects are significant. Sector is new to this model. The main effect of sector tells us that a one point increase in sector is associated with a 1.2 point increase in MathAch. Since public schools were coded with “0” and Catholic schools with “1,” this means that higher MatchAch is associated with the schools being Catholic. Keep in mind that this is “above and beyond” other effects in the model. Also new to this model are the interactions with cSES. The MeanSES x cSES interaction indicates that the slopes for predicting MathAch from cSES differ across levels of MeanSES. The Sector x cSES interaction indicates that the slopes for predicting MathAch from cSES differ between public and Catholic schools. Note that Singer reported that she tested for a MeanSES x Sector interaction and a MeanSES x cSES x Sector interaction but found them not to be significant. I created separate regressions equations for the public and the Catholic schools by substituting “0” and “1” for the values of sector. For the public schools, that yields MathAch = 12.11 + 5.34(MeanSES) + 1.22(0) + 2.94(cSES) + 1.04(MeanSES)(cSES) - 1.64(cSES)(0). For the Catholic schools that yields MathAch = 12.11 + 5.34(MeanSES) + 1.22(1) + 2.94(cSES) + 1.04(MeanSES*cSES) - 1.64(cSES)(0). These simplify to: Public: 12.11 + 5.34(MeanSES) + 2.94(cSES) + 1.04(MeanSES)(cSES) Catholic: 13.33 + 5.34(MeanSES) + 1.30(cSES) + 1.04(MeanSES)(cSES) As you can see, MathAch is significantly higher in the Catholic schools and the effect of cSES on MathAch is significantly greater in the public schools. The MeanSES x cSES interaction can be illustrated by preparing a plot of the relationship between MathAch and cSES at each of two or three levels of MeanSES – for example, when MeanSES is its first quartile, its second quartile, and its third quartile. Italassi could be used to illustrate this interaction interactively, but it is hard to move that slider in the published article. 6 At the mean for sector (.493), MathAch = 12.11 + 5.34(MeanSES) + 1.22(.493) + 2.94(cSES) + 1.04(MeanSES)(cSES) - 1.64(cSES)(.493) = 12.71 + 5.34(MeanSES) + 2.13(cSES) + 1.04(MeanSES)(cSES). At Q1 for MeanSES (-.32), MathAch = 12.71 -1.71 + 2.13(cSES) - 0.32(cSES) = 11.00 + 1.81(cSES). At Q2 for MeanSES (.038), MathAch = 12.71 + .03 + 2.13(cSES) + .038(cSES) = 12.74 + 2.17(cSES). At Q3 for MeanSES (.33), MathAch = 12.71 +1.76 + 2.13(cSES) + 0.33(cSES) = 14.47 + 2.47(cSES). For each of these conditional regressions I shall predict MatchAch at two values of cSES (-3 and +3) and then produce an overlay plot with the three lines. Here is the table of predicted values: MeanSES cSES -3 +3 Difference Q1 5.57 16.43 10.86 Q2 6.23 19.25 13.02 Q3 7.06 21.88 14.82 MathAch Here is a plot of the relationship between cSES and MathAch at each of three levels of MeanSES. Notice that the slope increases as MeanSES increases. MeanSES=Q1 MeanSES=Q2 MeanSES=Q3 cSES Look at the Output, Random Effects. The estimate for the difference in intercepts across schools, UN (1,1) remains significant, but now the estimate for the differences across schools in slope (for predicting MathAch from cSES), UN (2,2), is small and not significant, as is the estimate for the covariance between intercepts and slopes, UN (2,1). Perhaps I should trim the model, removing those components. 7 Model 6: Trimmed In this model I remove the random effect of cSES slopes (and thus also the interaction between those slopes and the intercepts). Because there is only one random effect, I no longer need to use “type = un.” SAS Code. title 'Model 6: Simpler Model Without cSES Slopes'; proc mixed noclprint covtest noitprint; class School; model MathAch = MeanSES Sector cSES MeanSES*cSES Sector*cSES / solution ddfm = bw notest; random intercept / subject = School; run; data p; df = 2; p = 1-probchi(1.1,2); proc print data = pvalue noobs; run; Look at the Output. As before, all the fixed effects are significant. Fit Statistics -2 Res Log Likelihood AIC (smaller is better) AICC (smaller is better) BIC (smaller is better) 46503.7 46511.7 46511.7 46524.0 -2 Res Log Likelihood AIC (smaller is better) AICC (smaller is better) BIC (smaller is better) 46504.8 46508.8 46508.8 46514.9 Trimming the model has increased the log likelihood statistic by 1.1, indicating slightly poorer fit. We can evaluate the significance of this change with a Chi-square on 2 df (one df for each parameter trimmed, the slopes and the Slope x Intercept interaction). As you can see, deleting those two parameters has not significantly affected the fit of the model to the data. SAS Results HLM Cheat Sheet – for symbols commonly used in HLM equations Return to Wuensch’s Stats Lessons Page Resources for Hierarchical Linear Modeling Karl L. Wuensch, East Carolina Univ., Dept. of Psychology, Greenville, NC 27858, USA October, 2013


