Ecology Part B Handout Org X Ecology Part B.Populations
advertisement

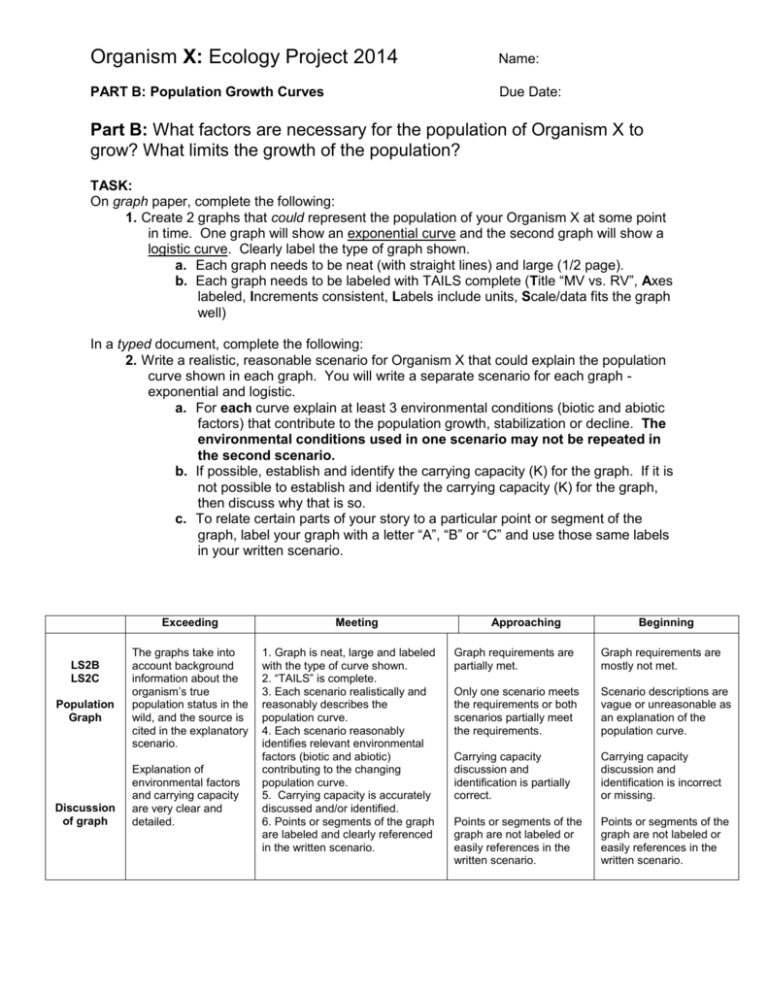
Organism X: Ecology Project 2014 Name: PART B: Population Growth Curves Due Date: Part B: What factors are necessary for the population of Organism X to grow? What limits the growth of the population? TASK: On graph paper, complete the following: 1. Create 2 graphs that could represent the population of your Organism X at some point in time. One graph will show an exponential curve and the second graph will show a logistic curve. Clearly label the type of graph shown. a. Each graph needs to be neat (with straight lines) and large (1/2 page). b. Each graph needs to be labeled with TAILS complete (Title “MV vs. RV”, Axes labeled, Increments consistent, Labels include units, Scale/data fits the graph well) In a typed document, complete the following: 2. Write a realistic, reasonable scenario for Organism X that could explain the population curve shown in each graph. You will write a separate scenario for each graph exponential and logistic. a. For each curve explain at least 3 environmental conditions (biotic and abiotic factors) that contribute to the population growth, stabilization or decline. The environmental conditions used in one scenario may not be repeated in the second scenario. b. If possible, establish and identify the carrying capacity (K) for the graph. If it is not possible to establish and identify the carrying capacity (K) for the graph, then discuss why that is so. c. To relate certain parts of your story to a particular point or segment of the graph, label your graph with a letter “A”, “B” or “C” and use those same labels in your written scenario. Exceeding LS2B LS2C Population Graph Discussion of graph The graphs take into account background information about the organism’s true population status in the wild, and the source is cited in the explanatory scenario. Explanation of environmental factors and carrying capacity are very clear and detailed. Meeting 1. Graph is neat, large and labeled with the type of curve shown. 2. “TAILS” is complete. 3. Each scenario realistically and reasonably describes the population curve. 4. Each scenario reasonably identifies relevant environmental factors (biotic and abiotic) contributing to the changing population curve. 5. Carrying capacity is accurately discussed and/or identified. 6. Points or segments of the graph are labeled and clearly referenced in the written scenario. Approaching Beginning Graph requirements are partially met. Graph requirements are mostly not met. Only one scenario meets the requirements or both scenarios partially meet the requirements. Scenario descriptions are vague or unreasonable as an explanation of the population curve. Carrying capacity discussion and identification is partially correct. Carrying capacity discussion and identification is incorrect or missing. Points or segments of the graph are not labeled or easily references in the written scenario. Points or segments of the graph are not labeled or easily references in the written scenario.


