Miners_fatigue_rainflow
advertisement
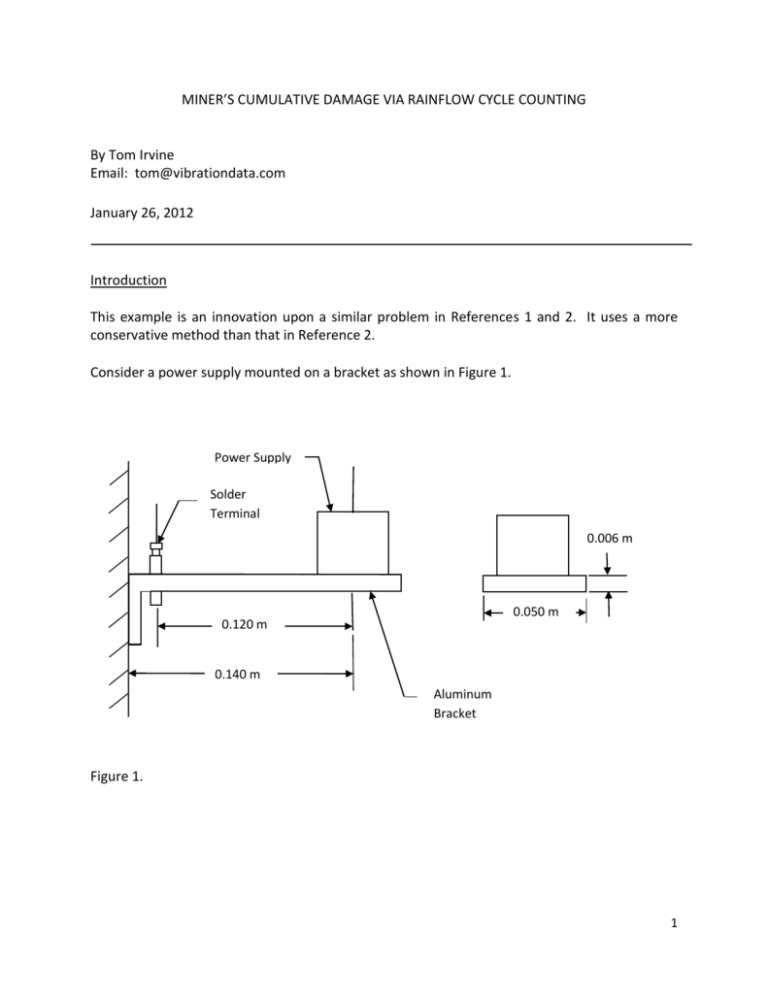
MINER’S CUMULATIVE DAMAGE VIA RAINFLOW CYCLE COUNTING By Tom Irvine Email: tom@vibrationdata.com January 26, 2012 Introduction This example is an innovation upon a similar problem in References 1 and 2. It uses a more conservative method than that in Reference 2. Consider a power supply mounted on a bracket as shown in Figure 1. Power Supply Solder Terminal 0.006 m 0.050 m 0.120 m 0.140 m Aluminum Bracket Figure 1. 1 The model parameters are Power Supply Mass M=0.20 kg Bracket Material Aluminum alloy 6061-T4 Mass Density ρ=2700 kg/m^3 Elastic Modulus E= 7.0e+10 N/m^2 Viscous Damping Ratio 0.05 The area moment of inertia of the beam cross-section I is I 1 b h3 12 (1) I 1 0.050 m0.006 m3 12 (2) I 9.0 (10 10 ) m 3 (3) The stiffness EI is EI 7.0 (10 10 ) N / m 2 9.0 (10 10 ) m 4 EI 63.0 N m 2 (4) (5) The mass per length of the beam, excluding the power supply, is 2700 kg / m3 0.050 m0.006 m (6) 0.810 kg / m (7) 2 The beam mass is L 0.810 kg / m0.14 m (8) L 0.113 kg (9) Model the system as a single-degree-of-freedom system subjected to base input as shown in Figure 2. x m c k y Figure 2. The natural frequency of the beam, from Reference 3, is given by fn 1 2 1 fn 2 3EI 0.2235 L m L3 3 63.0 N m 2 0.2235 0.113 kg (20.0 kg) 0.14 m 3 f n 88.0 Hz (10) (11) (12) 3 POWER SPECTRAL DENSITY 6.1 GRMS OVERALL 2 ACCEL (G /Hz) 0.1 0.01 0.001 10 100 1000 2000 FREQUENCY (Hz) Figure 3. Table 1. Base Input PSD, 6.1 GRMS Frequency (Hz) Accel (G^2/Hz) 20 0.0053 150 0.04 600 0.04 2000 0.0036 Now consider that the bracket assembly is subjected to the random vibration base input level shown in Figure 3 and in Table 1. The duration is 3 minutes. 4 Synthesized Time History Figure 4. An acceleration time history is synthesized to satisfy the PSD specification from Figure 3. The resulting time history is shown in Figure 4. The synthesis method is given in Reference 4. The corresponding histogram has a normal distribution, but the plot is omitted for brevity. Note that the synthesized time history is not unique. For rigor, the analysis in this paper could be repeated using a number of suitable time histories. 5 Figure 5. Verification that the synthesized time history meets the specification is given in Figure 5. 6 Acceleration Response Figure 6. The response acceleration in Figure 6 was calculated via the method in Reference 5. The response is narrowband. The oscillation frequency tends to be near the natural frequency of 88 Hz. The histogram has a normal distribution due to the randomly-varying amplitude modulation. The overall response level is 5.66 GRMS. This is also the standard deviation given that the mean is zero. The absolute peak is 24.5 G, which respresents a 4.3-sigma peak. Note that some fatigue methods assume that the peak response is 3-sigma and may thus underpredict fatigue damage. 7 Stress and Moment Calculation x L MR R F Figure 7. The following approach is a simplification. A rigorous method would calculate the stress from the strain at the fixed end. A free-body diagram of the beam is shown in Figure 7. The reaction moment MR at the fixed-boundary is MR F L (13) The force F is equal to the effect mass of the bracket system multiplied by the acceleration level. The effective mass me is m e 0.2235 L m (14) m e 0.2235 0.113 kg (0.20 kg) (15) m e 0.225 kg (16) The bending moment M̂ at a given distance L̂ from the force application point is M̂ m e A L̂ (17) where A is the acceleration at the force point. 8 The bending stress Sb is given by Sb K M̂ C / I (18) The variable K is the stress concentration factor. Assume that the stress concentration factor is 3.0 for the solder lug mounting hole. The variable C is the distance from the neutral axis to the outer fiber of the beam. The crosssection is uniform in the sample problem. Thus C is equal to one-half the thickness, or 0.003 m. Sb (t ) (K me L̂ C / I) A(t) (19) (K m e C / I) (3.0)(0.225 kg)0.003 m (0.120 m) / 9.0 (10 10 )m 4 (K m e C / I) 270000 kg/m 2 (20) (21) Apply an acceleration unit conversion factor. (K m e C / I) 9.81 m/sec^2/G 2.649E 06 kg/m 2 m / sec^ 2 / G (22) 9 Figure 8. The standard deviation is equivalent to 15 MPa. The highest peak is 65 MPa, which is 4.3sigma. Next, a rainflow cycle count was performed on the stress time history using the method in Reference 6. The binned results are shown in Table 2. The binned results are shown mainly for reference, given that this is a common presentation format in the aerospace industry. The binned results could be inserted into a Miner’s cumulative fatigue calculation. The method in this analysis, however, will use the raw rainflow results consisting of cycle-bycycle amplitude levels, including half-cycles. This brute-force method is more precise than using binned data. 10 Table 2. Stress Results from Rainflow Cycle Counting, Bin Format, Stress Unit: MPa, Base Input Overall Level = 6.1 GRMS Range Upper Limit Lower Limit Cycle Counts Average Amplitude Max Amp Min Amp Average Mean Max Mean Min Valley Max Peak 115.0 128.0 7.5 60.0 64.0 -2.5 0.2 3.6 -63.0 65.0 102.0 115.0 37.5 54.0 57.0 -3.1 0.1 3.8 -58.0 60.0 89.6 102.0 120 47.0 51.0 -3.4 0.3 5.6 -53.0 54.0 76.8 89.6 455.5 41.0 45.0 -5.1 0.1 4.7 -48.0 48.0 64.0 76.8 1087 35.0 38.0 -6.6 -0.1 6.7 -44.0 44.0 51.2 64.0 2149 28.0 32.0 -6.6 0.0 6.5 -36.0 38.0 38.4 51.2 3344 22.0 26.0 -7.6 -0.1 7.0 -32.0 31.0 25.6 38.4 4200 16.0 19.0 -8.4 0.0 6.7 -25.0 24.0 19.2 25.6 1980 11.0 13.0 -6.0 -0.1 5.2 -18.0 17.0 12.8 19.2 1468.5 8.1 9.6 -7.0 0.0 6.1 -14.0 14.0 6.4 12.8 987.5 4.9 6.4 -8.9 0.0 11.0 -13.0 15.0 3.2 6.4 659.5 2.3 3.2 -9.4 0.1 13.0 -12.0 15.0 0.0 3.2 10820 0.2 1.6 -40.0 0.1 40.0 -41.0 40.0 Note that: Amplitude = (peak-valley)/2 11 Miner’s Cumulative Fatigue Let n be the number of stress cycles accumulated during the vibration testing at a given level stress level represented by index i. Let N be the number of cycles to produce a fatigue failure at the stress level limit for the corresponding index.. Miner’s cumulative damage index Rn is given by m n R i N i 1 i (40) where m is the total number of cycles or bins depending on the analysis type. In theory, the part should fail when Rn (theory) = 1.0 (41) For aerospace electronic structures, however, a more conservative limit is used Rn(aero) = 0.7 (42) The number of allowable cycles for a given stress level are determined from an S-N fatigue curve for the 6061-T4 aluminum bracket in the sample problem. 12 S-N FATIGUE CURVE FOR ALUMINUM 6061-T4 FOR REFERENCE ONLY 250 STRESS (MPa) 200 150 100 50 0 0 10 10 1 10 2 10 3 10 4 10 5 10 6 10 7 10 8 10 9 NUMBER OF CYCLES TO FAIL, N Figure 9. The fatigue curve for aluminum 6061-T4 is shown in Figure 9, as adapted from Reference 7. (Note that published S-N curves all tend to be somewhat tenuous.) Note that a "less conservative" fatigue curve for this same alloy is given in Reference 1. The curve in Figure 9 is characterized by the following two equations, where S is the bending stress in MPa. S 17 log N 240 MPa (43) 240 S N 10^ 17 (44) 13 Table 3. Fatigue Damage Results for Various Input Levels, 180 second Duration Input Overall Margin (dB) R Level 6.1 0 4.92E-09 8.6 3 4.70E-08 12.2 6 2.24E-06 17.2 9 0.00114 19.3 10 0.0158 21.6 11 0.351 24.3 12 Fail The accumulated fatigue damage was calculated for a family of cases as shown in Table 3. Each case used the base input PSD from Figure 3 with the indicated added margin. Each full and half-cycle from the rainflow results was accounted for. An allowable N value was calculated for each stress amplitude S using equation (44) for each cycle or half-cycle. A running summation was made using equation (40). Again, the success criterion was R < 0.7. The 12-dB margin case produced an outright failure because several stress cycles exceeded an amplitude of 240 MPa which is the maximum allowable amplitude for one cycle per Figure 9. 14 References 1. Dave Steinberg, Vibration Analysis for Electronic Equipment, Second Edition, Wiley, New York, 1988. 2. T. Irvine, Random Vibration Fatigue, Revision B, Vibrationdata, 2003. 3. T. Irvine, Bending Frequencies of Beams, Rods, and Pipes, Revision S, Vibrationdata, 2012. 4. T. Irvine, A Method for Power Spectral Density Synthesis, Rev B, Vibrationdata, 2000. 5. David O. Smallwood, An Improved Recursive Formula for Calculating Shock Response Spectra, Shock and Vibration Bulletin, No. 51, May 1981. 6. ASTM E 1049-85 (2005) Rainflow Counting Method, 1987. 7. Shigley, Mechanical Engineering Design, Third Ed, Table A-18, McGraw-Hill, New York, 1977. 8. V. Adams and A. Askenazi, Building Better Products with Finite Element Analysis, OnWord Press, Santa Fe, N.M., 1999. 15 APPENDIX A Fatigue Cracks A ductile material subjected to fatigue loading experiences basic structural changes. The changes occur in the following order: 1. Crack Initiation. A crack begins to form within the material. 2. Localized crack growth. Local extrusions and intrusions occur at the surface of the part because plastic deformations are not completely reversible. 3. Crack growth on planes of high tensile stress. The crack propagates across the section at those points of greatest tensile stress. 4. Ultimate ductile failure. The sample ruptures by ductile failure when the crack reduces the effective cross section to a size that cannot sustain the applied loads. Design and Environmental Variables affecting Fatigue Life The following factors decrease fatigue life. 1. Stress concentrators. Holes, notches, fillets, steps, grooves, and other irregular features will cause highly localized regions of concentrated stress, and thus reduce fatigue life. 2. Surface roughness. Smooth surfaces are more crack resistant because roughness creates stress concentrators. 3. Surface conditioning. Hardening processes tend to increase fatigue strength, while plating and corrosion protection tend to diminish fatigue strength. 4. Environment. A corrosive environment greatly reduces fatigue strength. A combination of corrosion and cyclical stresses is called corrosion fatigue. 16

