Cluster Analysis Why and what it is Organize entities (sampling units
advertisement
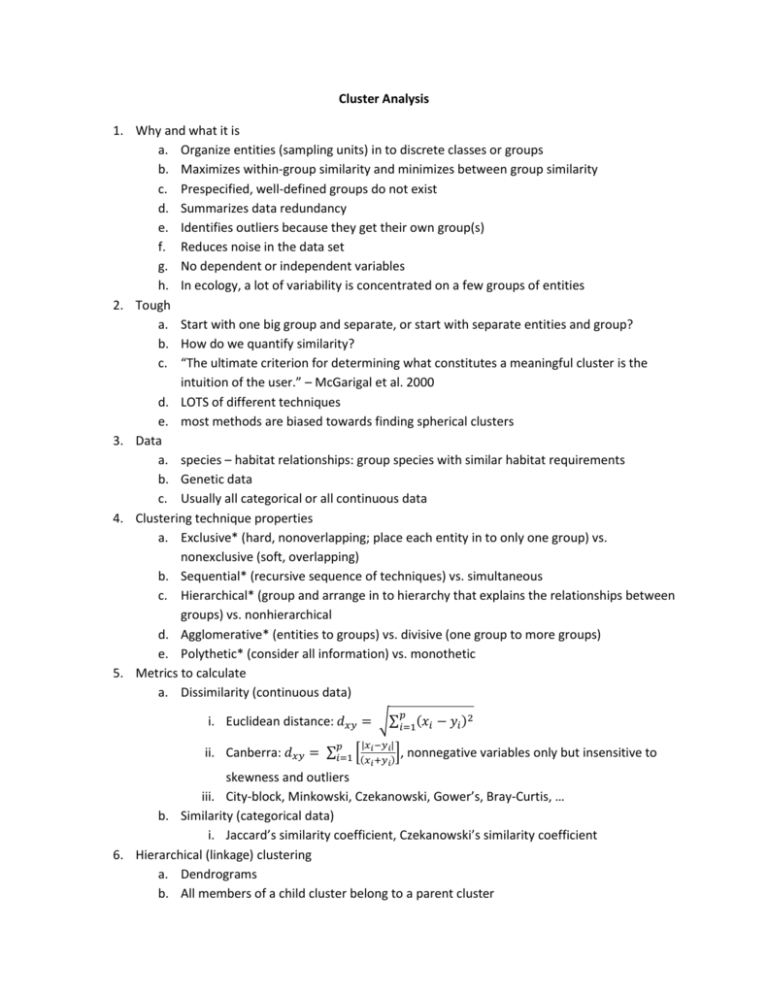
Cluster Analysis 1. Why and what it is a. Organize entities (sampling units) in to discrete classes or groups b. Maximizes within-group similarity and minimizes between group similarity c. Prespecified, well-defined groups do not exist d. Summarizes data redundancy e. Identifies outliers because they get their own group(s) f. Reduces noise in the data set g. No dependent or independent variables h. In ecology, a lot of variability is concentrated on a few groups of entities 2. Tough a. Start with one big group and separate, or start with separate entities and group? b. How do we quantify similarity? c. “The ultimate criterion for determining what constitutes a meaningful cluster is the intuition of the user.” – McGarigal et al. 2000 d. LOTS of different techniques e. most methods are biased towards finding spherical clusters 3. Data a. species – habitat relationships: group species with similar habitat requirements b. Genetic data c. Usually all categorical or all continuous data 4. Clustering technique properties a. Exclusive* (hard, nonoverlapping; place each entity in to only one group) vs. nonexclusive (soft, overlapping) b. Sequential* (recursive sequence of techniques) vs. simultaneous c. Hierarchical* (group and arrange in to hierarchy that explains the relationships between groups) vs. nonhierarchical d. Agglomerative* (entities to groups) vs. divisive (one group to more groups) e. Polythetic* (consider all information) vs. monothetic 5. Metrics to calculate a. Dissimilarity (continuous data) 𝑝 i. Euclidean distance: 𝑑𝑥𝑦 = √∑𝑖=1(𝑥𝑖 − 𝑦𝑖 )2 |𝑥 −𝑦 | 𝑝 ii. Canberra: 𝑑𝑥𝑦 = ∑𝑖=1 [(𝑥𝑖+𝑦𝑖)], nonnegative variables only but insensitive to 𝑖 𝑖 skewness and outliers iii. City-block, Minkowski, Czekanowski, Gower’s, Bray-Curtis, … b. Similarity (categorical data) i. Jaccard’s similarity coefficient, Czekanowski’s similarity coefficient 6. Hierarchical (linkage) clustering a. Dendrograms b. All members of a child cluster belong to a parent cluster 7. 8. 9. 10. c. Compute the distances between entities based on the data characteristics (variables) d. Not robust to outliers e. Complexity makes it too slow for large datasets Centroid-based clustering (k-means clustering) a. Find the centers of k clusters and assign the entities to the nearest cluster center by minimizing squared distances. b. Most often, k must be defined in advance c. Prefers clusters of equal size d. Optimizes cluster centers, not cluster borders Distribution-based clustering a. Determine which entities belong to the same distribution b. Overfitting (too much complexity) is common c. Constrained by a need to define a distribution Density-based clustering a. Connect entities that are within a certain distance threshold b. DBSCAN i. minimum number of points per cluster (minPts) 1. = 1, each entity is its own cluster 2. = 2, hierarchical 3. ≥ 3, more density based ii. Distance cut-off (Ɛ) c. Advantages i. Do not need to predetermine the number of clusters ii. Cluster shape is arbitrary iii. Robust to outliers iv. Two parameters: minimum number of points per cluster (minPts) and v. Insensitive to entity order d. Disadvantages i. Not completely deterministic ii. Differences in densities are difficult Comparing method results (cluster evaluation, internal validation) a. Davies-Bouldin index i. 𝐷𝐵 = 1 𝑛 ∑𝑛𝑖=1 max ( 𝜎𝑖 +𝜎𝑗 ) 𝑗 ≠𝑖 𝑑(𝑐𝑖 ,𝑐𝑗 ) ii. n = number of clusters iii. cx = centroid of cluster x iv. σx = average distance of all entities in a cluster to its centroid v. d(cx,cy) = distance between two centroids vi. lowest index = better method b. Dunn index: highest index = best method 11. Nonexclusive methods: Fuzzy C-means, Soft K-means,…


![ifac.bla [ifac] - neuron.tuke.sk](http://s3.studylib.net/store/data/007905895_2-0ea2ad157aea7c49fe73ac67f5ab7aac-300x300.png)
