Experiment 9
advertisement
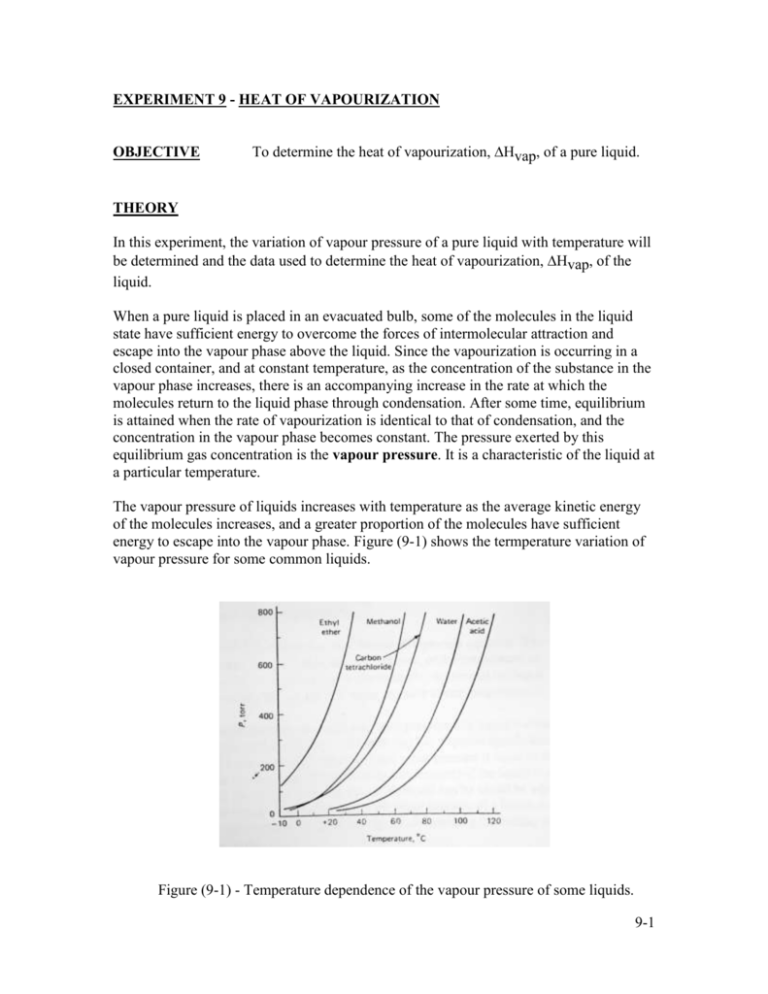
EXPERIMENT 9 - HEAT OF VAPOURIZATION OBJECTIVE To determine the heat of vapourization, Hvap, of a pure liquid. THEORY In this experiment, the variation of vapour pressure of a pure liquid with temperature will be determined and the data used to determine the heat of vapourization, Hvap, of the liquid. When a pure liquid is placed in an evacuated bulb, some of the molecules in the liquid state have sufficient energy to overcome the forces of intermolecular attraction and escape into the vapour phase above the liquid. Since the vapourization is occurring in a closed container, and at constant temperature, as the concentration of the substance in the vapour phase increases, there is an accompanying increase in the rate at which the molecules return to the liquid phase through condensation. After some time, equilibrium is attained when the rate of vapourization is identical to that of condensation, and the concentration in the vapour phase becomes constant. The pressure exerted by this equilibrium gas concentration is the vapour pressure. It is a characteristic of the liquid at a particular temperature. The vapour pressure of liquids increases with temperature as the average kinetic energy of the molecules increases, and a greater proportion of the molecules have sufficient energy to escape into the vapour phase. Figure (9-1) shows the termperature variation of vapour pressure for some common liquids. Figure (9-1) - Temperature dependence of the vapour pressure of some liquids. 9-1 It is apparent that the dependence is not a simple proportionality. The rate of increase of pressure with temperature becomes larger as the temperature rises. With infinitesimal temperature changes, the vapour pressure varies according to to following equation. H vap d (ln p ) = dT RT 2 eqn (9-1) where R is the gas constant. When eqn (9-1) is integrated, the following equations are obtained: ln p = - H vap 1 + C R T H vap 1 + C 2.303 R T ( y = mx +b ) log p = - eqn (9-2) eqn (9-3) and log H vap 1 p2 1 = p1 2.303 R T2 T1 eqn (9-4) where, in eqn (9-3), C is the integration constant, in eqn (9-4), p1 is the vapour pressure of the liquid at absolute temperature, T1, p2 is the vapour pressure of the liquid at absolute temperature, T2. Eqn (9-3) can be applied by graphing "log p versus 1/T". By drawing the best straight line through the points, the slope of the line can be calculated and the heat of vapourization, Hvap, can be determined experimentally. Eqn (9-4) is known as the Clausius-Clapeyron equation. It can be used to evaluate vapour pressure at any temperature of interest, or the temperature at which a liquid exhibits a particular vapour pressure (for example, the normal boiling point), when the heat of vapourization, Hvap, and the vapour pressure at one temperature is known. The temperature at which the vapour pressure of a liquid is equal to standard atmospheric pressure (1 atm = 760 mm Hg) has a special significance. It is called the normal boiling point. But whenever, the vapour pressure is equal to the pressure over the liquid, the boiling point (or, the boiling temperature) of the liquid is achieved. In this experiment, the boiling temperatures of the liquid can be varied by adjusting the pressure above the liquid. You will measure the vapour pressure of a liquid over a range of pressure from approximately 5 to 20 cm Hg. by determining the boiling point at selected pressure values. 9-2 A useful generalization, known as Trouton's rule, that works for many liquids at their normal boiling points is that H ovap Tboilingpoint 88 joules mole -1 K -1 eqn (9-5) H ovap , which is a measure of disorder produced in transferring 1 mole of molecules Tboiling point from liquid to vapour at 1 atm pressure, is roughly comparable ( 88 joules/mole K) for different liquids. Instances where Trouton's rule fails is for liquids such as water and ethanol where hydrogen bonding among molecules produces a greater degree of order than would otherwise be expected in the liquid state. The degree of disorder produced in the vapourization process is greater than normal and H ovap Tboilingpoint 88 joules mole -1 K -1 eqn (9-6) 9-3 PROCEDURE 1. Set up the apparatus as shown in Figure (9-2). ballast bulb thermometer water out mercury manometer water in pump boiling chips condenser heater manometer stopcock pump's throttle valve Figure (9-2) - Vapour-Pressure Apparatus Make sure that the water to the reflux condenser in turned on and the apparatus is connected to the vacuum (and not the pressure outlet) of the pump. 2. Fill the round-bottom flask about one-third full of toluene. Add a few fresh pieces of boiling chips to reduce bumping. You may need to insulate the flask. [ Do not grease the glass joints unless you are absolutely certain that the grease is INSOLUBLE in the test solution. If it is necessary, lubricate the joints with the test solution.] 3. Close the stopcock leading to the manometer and evacuate the air from the system. [The stopcock leading to the manometer should only be opened when taking a pressure reading. All other times, this stopcock remains in the 'closed' position.] 4. Heat the toluene to boiling. Avoid heating the liquid too strongly, otherwise, the vapour will escape past the reflux condenser and contaminate the manometer. 9-4 5. When conditions appear to be at equilibrium, open the manometer stopcock and record the difference in height of the mercury column in centimeter. Record the boiling temperature to the nearest 0.1 oC. 6. Increase the pressure in the system by slowly introducing air through the vacuum pump's throttle valve. A minute turn ( < 1/16 of a turn) lets in sufficient air to determine a new boiling temperature. Turn the throttle valve until you can see a small movement in the mercury column. Close the manometer stopcock. 7. Increase the heat until the toluene boils. Record the temperature and open the manometer stopcock to take a pressure reading. [ Your aim is to take 10 READINGS at different boiling temperatures and pressures. Boiling temperature range: 50 oC to 80 oC. for pressure range: 5 cm Hg to 20 cm Hg. ] 8. Repeat step 6 and take 10 temperature/pressure readings. 9-5 DATA SHEET Sample used : ____________________________________________ Room temperature : _______________________________________ Pressure, p (cm Hg) log p Boiling temperature (oC) Temperature, T (K) 1/ T (K-1) 9-6 TREATMENT OF DATA 1. 2. Enter your data on the data sheet. 1 Plot a graph of "log p versus " The graph should be linear. Determine the T slope of the line and indicate the units of the measured slope. 3. Calculate Hvap (joules/mole) for toluene. 4. Compare the experimentally determined Hvap to the accepted value and calculate the percentage error. 9-7 Questions 1. Calculate the slope of the graph "log p versus 1/T". Include the units of the measured slope. 2. Calculate Hvap. Include the units of Hvap. 3. Report the theoretical value of Hvap and cite the reference source. Use Trouton's rule to determine the correct theoretical value. 4. Calculate the % error. 9-8
