Review Exam 2 - De Anza College
advertisement
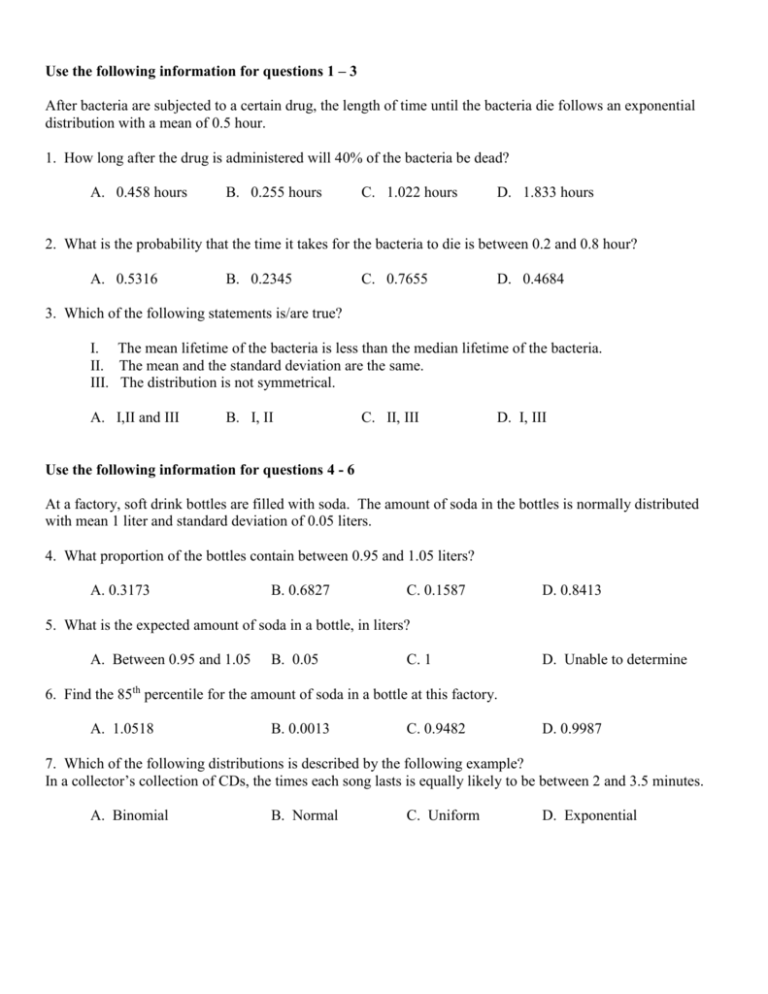
Use the following information for questions 1 – 3 After bacteria are subjected to a certain drug, the length of time until the bacteria die follows an exponential distribution with a mean of 0.5 hour. 1. How long after the drug is administered will 40% of the bacteria be dead? A. 0.458 hours B. 0.255 hours C. 1.022 hours D. 1.833 hours 2. What is the probability that the time it takes for the bacteria to die is between 0.2 and 0.8 hour? A. 0.5316 B. 0.2345 C. 0.7655 D. 0.4684 3. Which of the following statements is/are true? I. The mean lifetime of the bacteria is less than the median lifetime of the bacteria. II. The mean and the standard deviation are the same. III. The distribution is not symmetrical. A. I,II and III B. I, II C. II, III D. I, III Use the following information for questions 4 - 6 At a factory, soft drink bottles are filled with soda. The amount of soda in the bottles is normally distributed with mean 1 liter and standard deviation of 0.05 liters. 4. What proportion of the bottles contain between 0.95 and 1.05 liters? A. 0.3173 B. 0.6827 C. 0.1587 D. 0.8413 5. What is the expected amount of soda in a bottle, in liters? A. Between 0.95 and 1.05 B. 0.05 C. 1 D. Unable to determine 6. Find the 85th percentile for the amount of soda in a bottle at this factory. A. 1.0518 B. 0.0013 C. 0.9482 D. 0.9987 7. Which of the following distributions is described by the following example? In a collector’s collection of CDs, the times each song lasts is equally likely to be between 2 and 3.5 minutes. A. Binomial B. Normal C. Uniform D. Exponential Use the following information for questions 8 - 10 Suppose the lifetime of a certain kind of battery is exponentially distributed, with an average of 40 hours. We are interested in the average lifetime of 16 of these batteries. 8. What is the distribution for the average lifetime of 16 of these batteries? A. Exp(1/40) B. N(40,10) C. N(40,40) D. Exp(40) 9. Find the probability that the average lifetime of 16 batteries is between 35 and 40 hours. A. 0.0490 B. 0.9510 C. 0.0497 D. 0.1915 10. Find the 75th percentile for the average lifetime of 16 batteries in hours. A. 46.74 B. 66.98 C. 55.45 D. 11.51 Use the following information for questions 11 - 13 The time to wait for an Amtrak train is distributed uniformly from 0 to 48 minutes. 11. The distribution to use is: A. U(0,48) B. Exp (1/24) C. N(24, 13.86) D. N(24, 1.55) C. 0.875 D. 0.8542 12. The probability the time to wait will be more than 6 minutes is: A. 0.1458 B. 0.125 13. Interpret the 90th percentile for the time to wait for an Amtrak train: A. B. C. D. 90% of the wait times will be at least 4.8 minutes. 90% of the wait times will be at most 4.8 minutes. 90% of the wait times will be at least 43.2 minutes. 90% of the wait times will be at most 43.2 minutes. 14. Ejection Seats in Fighter Jets. Suppose the weight of women in the US is modeled by a normal distribution with mean 143 pounds and standard deviation 29 pounds. Ejection seats in fighter jets are designed for people weighing between 110 and 170 pounds. What percentage of women in the US are outside of this weight range? A. 30.35 B. 69.65 C. 75.74 D. 24.26 Use the following for questions 15 and 16 Suppose De Anza students have an average age of 27 with a standard deviation of 6.2 years. If we take a random sample of 100 De Anza students and compute the average age of the sampled students, then 15. In words, X-bar = A. Age, in years, for one De Anza student. B. Age, in years, for 100 De Anza students. C. Average age, in years, for one De Anza student. D. Average age, in years, for 100 De Anza students. 16. How does the graph of X-bar compare to X? A. B. A. A. X-bar is more peaked than X and has the same average as X. X-bar is more peaked than X and is shifted to the left of X. X-bar is flatter than X and has the same average as X. X-bar is more peaked than X and is shifted to the right of X. Use the following information for questions 17 - 19 A newspaper claims the average household income in Gilroy is $63,000. To test whether this is correct, you conduct a survey of 62 households in Gilroy. Your survey produces a sample average household income of $62,500 with a sample standard deviation of $1350. 17. Using the survey results, the error bound for a 90% confidence interval for the true average household income in Gilroy is: A. 282 B. 564 C. 572 D. 286 18. If the newspaper wanted to decrease the width of the confidence interval, which of the following would achieve this? I. II. III. A. I only Increase the population size. Increase the confidence level. Increase the sample size. B. II only C. III only D. II and III 19. Interpret the 90% confidence interval: A. If we took repeated samples, approximately 90% of the samples would produce the same confidence interval. B. If we took repeated samples, approximately 90% of the confidence intervals calculated from these samples would contain the sample mean. C. If we took repeated samples, approximately 90% of the confidence intervals calculated from these samples would contain the true population mean. D. If we took repeated samples, the sample mean would equal the population mean in approximately 90% of the samples. 20. A student is doing a project on the volume of a large soda from a local convenience store. The store claims their large soda is 24 fluid ounces. The student believes the true volume is less than this and over the course of a few weeks, buys 27 large sodas and carefully measures the volume of each. He finds the sample average volume is 23.5 fluid ounces with a sample standard deviation of 0.8 fluid ounces. A 96% confidence interval for the population mean is: A. (23.20,24.80) B. (23.17,23.83) C. (23.18,23.82) D. (23.30,23.70) 21. A local library district is planning to put a special library tax on the ballot for the November 2014 election. For the tax to pass, at least two-thirds (2/3) of voters in the district must vote in favor of the tax. To see if there is sufficient support, a survey of 560 likely voters in the district is taken. Three hundred sixty two (362) voters in the survey are in favor of the tax. A 92% confidence interval for the proportion of voters in favor of the tax is: A. (0.605,0.688) B. (0.613,0.680) C. (0.607,0.686) D. (0.611,0.682)


