Supplementary Figure 1: GC content and CpG density of Ion Torrent
advertisement
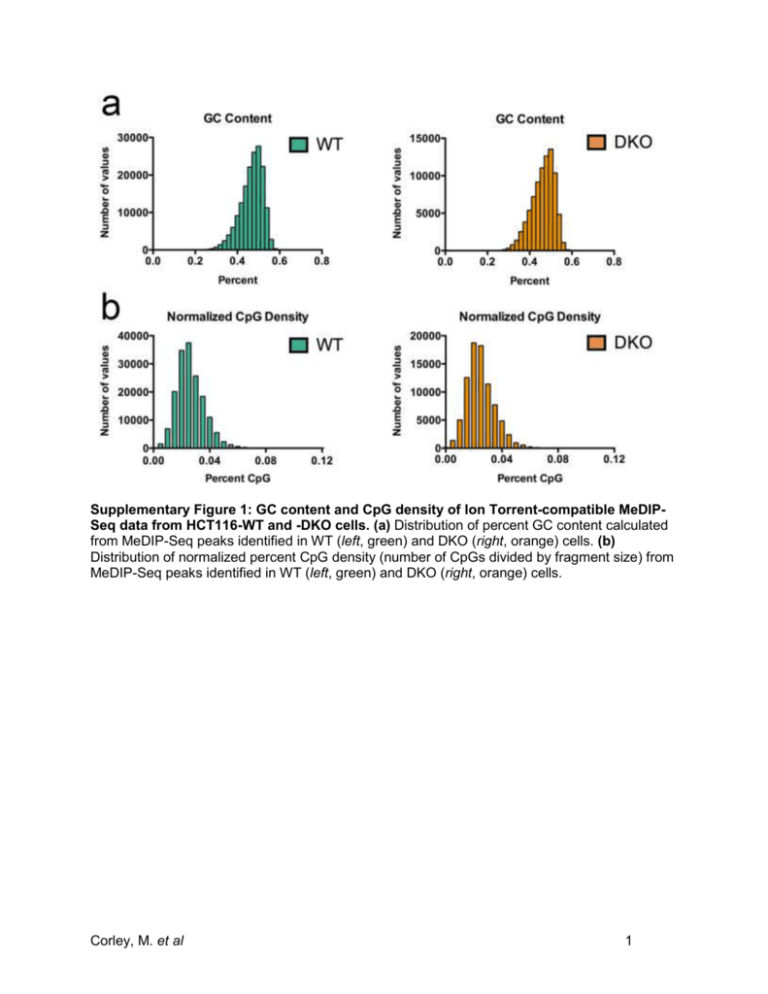
Supplementary Figure 1: GC content and CpG density of Ion Torrent-compatible MeDIPSeq data from HCT116-WT and -DKO cells. (a) Distribution of percent GC content calculated from MeDIP-Seq peaks identified in WT (left, green) and DKO (right, orange) cells. (b) Distribution of normalized percent CpG density (number of CpGs divided by fragment size) from MeDIP-Seq peaks identified in WT (left, green) and DKO (right, orange) cells. Corley, M. et al 1 Supplementary Figure 2: Ion Torrent-compatible MeDIP-Seq detects previously observed differential DNA methylation between HCT116-WT and -DKO cells at cancer-relevant genes. Scaled chromosomal view of MeDIP-Seq peaks of methylation enrichment over the proximal promoter regions of the BHLHB9, SCNN1B, HOXD1, and RASGRF2 genes as indicated. 5-mC MeDIP-Seq from WT and DKO cells are displayed as RPM below the RefSeq annotation of each respective gene (blue lines). Methylation enrichment is displayed in grey, with red vertical lines correspond to areas containing CpGs. Chromosome position and gene orientation are displayed. Corley, M. et al 2 Supplementary Figure 3: Ion Torrent-compatible MeDIP-Seq identifies novel differentially methylated loci in HCT116 cells. (a) Scaled chromosomal view of the MeDIP-Seq enrichment of methylation over the proximal promoter region of the PAX6 gene. MeDIP-Seq data displayed as RPM from WT and DKO cells are shown below the RefSeq annotation of the gene (blue lines) and a CpG island (green). CpG methylation data of each 450k array probe over this region from WT and DKO cells are shown to scale as colored bars representing the degree of methylation (blue, low-; violet, intermediate-; and orange, high-levels of methylation). Percent methylation (calculated from -values) of these CpGs is shown under each bar. (b) Same as in a, comparing methylation levels at the proximal promoter of the MEIS1 gene. (c) The average expression of PAX6 is significantly elevated in DKO compared to WT cells. Average expression values relative to ACTB and s.e.m. from triplicate qPCR is shown. P-value indicated was calculated using two-sided Student’s t-test. (d) Same as in c, comparing expression levels of MEIS1 in WT and DKO cells. Corley, M. et al 3 Supplementary Figure 4: Decreased local methylation over alternatively spliced exons associate with aberrant splicing events. (a) Aberrant alternatively spliced exons (AASE) exhibit substantial reduction of DNA methylation in DKO compared to WT cells. Box and whiskers graph displays methylation levels measured in WT and DKO cells from integrated 450k array probes overlapping AASE. Box extends from 25th to 75th percentiles. Line, indicates median and +, indicates mean value. AASE were determined by MISO analysis of WT and DKO RNA-Seq data. (b) Distribution of 450k array CpG methylation levels of probes that overlap with AASE measured in WT (left, green) and DKO (right, orange) cells. The methylation state of each 450k array probe overlapping AASE were binned into increments of 10% methylation accordingly (x-axis) and the total number of CpGs they represent in each bin is displayed (yaxis). Corley, M. et al 4 Supplementary Figure 5: Ion Torrent-compatible MeDIP-Seq distinguishes variants of DNA modification in brain. (a) Efficiency of 5-hmC MeDIP assessed by spiked-in 5-hmC, 5mC, and unmethylated DNA and compared to a 10% input DNA control. qPCR was performed and % enrichment of the indicated DNA was calculated according to Diagenode (cat. no. AF104-0016). (b) Sequence coverage of genome-wide CpGs for 5-hmC (left) and 5-mC (right) brain MeDIP-Seq libraries sequenced on the Ion Proton platform calculated using MEDIPS v.1.14.0 software. Pie charts illustrate the fraction of CpGs covered by the indicated number of reads in relation to the total genomic CpG content. Corley, M. et al 5 Supplementary Figure 6: Ion Torrent-compatible MeDIP-Seq yields comparable results to that acquired by Illumina-based sequencing. (a) MeDIP-Seq datasets of 5-mC methylation profiling of brain tissue specimens from Ion Torrent and Illumina platforms. The table compares sequencing data metrics between the different MeDIP-Seq datasets. *, estimate of genome coverage was calculated based on the total number of mapped reads and average read length over the total hg19 content (~ 3 billion bp). (b) Distribution of 5-mC methylation as measured in RPM from brain MeDIP-Seq libraries sequenced on the Ion Torrent (light blue) or Illumina (dark blue) platform is displayed ± 2 kb over TSS, gene bodies, and TES in brain. (c) Scaled chromosomal view of 5-mC methylation over the imprinted gene SNURF. Data from Ion Torrent MeDIP-Seq (top) and Illumina MeDIP-Seq (bottom) is displayed using RPM values over the indicated regions. RefSeq annotation (blue lines) of the gene and CpG island (green bar) are shown. (d) Scaled chromosomal view of 5-mC methylation over the imprinted gene PEG10. Data displayed as described in c. Corley, M. et al 6 Supplementary Table 1. Total number of sequenced reads (M, million) from Ion Torrentcompatible MeDIP-Seq libraries aligned to the hg19 assembly of the human genome. Total Trimmed Mapped Reads to Human Sequencer Sample Library Raw Reads Genome (hg19) Proton HCT116-WT 5-mC 59.97 M 58.85 M Proton HCT116-DKO 5-mC 56.86 M 55.46 M PGM HCT116-WT 5-mC 4.37 M 4.35 M PGM HCT116-DKO 5-mC 4.63 M 4.61 M Proton Human Brain 5-mC 52.48 M 51.35 M Proton Human Brain 5-hmC 66.62 M 65.13 M Corley, M. et al 7
