Some notes on how to interpret graphs
advertisement

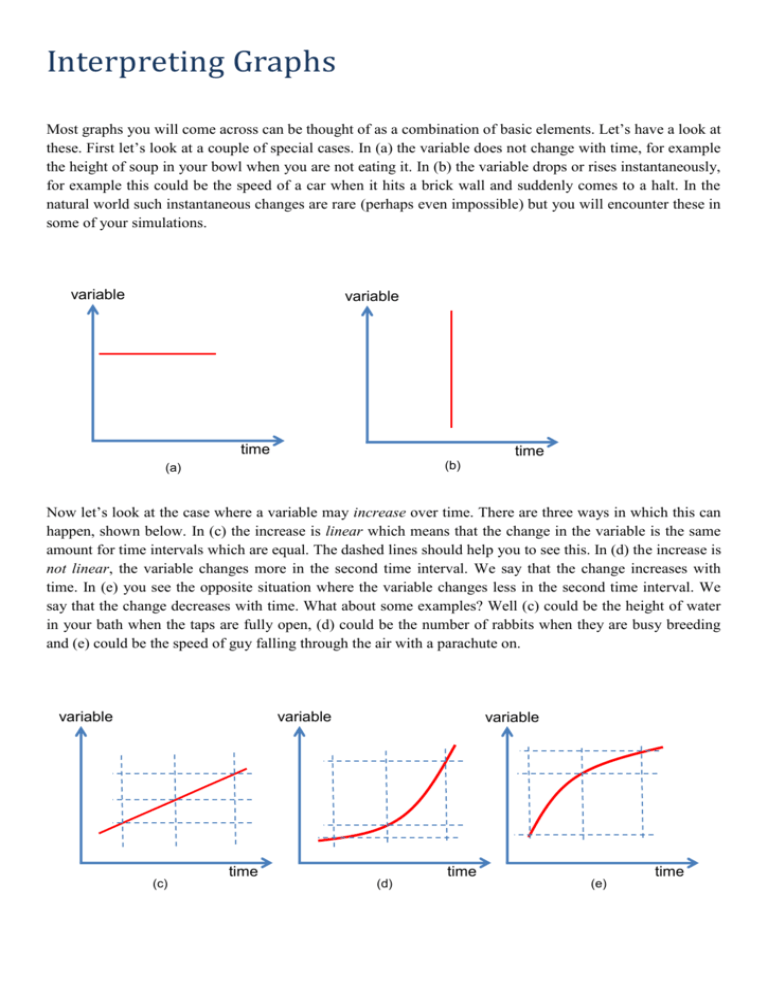
Interpreting Graphs Most graphs you will come across can be thought of as a combination of basic elements. Let’s have a look at these. First let’s look at a couple of special cases. In (a) the variable does not change with time, for example the height of soup in your bowl when you are not eating it. In (b) the variable drops or rises instantaneously, for example this could be the speed of a car when it hits a brick wall and suddenly comes to a halt. In the natural world such instantaneous changes are rare (perhaps even impossible) but you will encounter these in some of your simulations. variable variable time time (b) (a) Now let’s look at the case where a variable may increase over time. There are three ways in which this can happen, shown below. In (c) the increase is linear which means that the change in the variable is the same amount for time intervals which are equal. The dashed lines should help you to see this. In (d) the increase is not linear, the variable changes more in the second time interval. We say that the change increases with time. In (e) you see the opposite situation where the variable changes less in the second time interval. We say that the change decreases with time. What about some examples? Well (c) could be the height of water in your bath when the taps are fully open, (d) could be the number of rabbits when they are busy breeding and (e) could be the speed of guy falling through the air with a parachute on. variable variable variable time (c) time (d) time (e) Finally there’s the case where a variable may decrease with time. Not surprisingly we have three ways in which this can happen, In (f) the decrease is linear where the variable drops the same amount in the two equal time intervals. In (g) the drop in the first time interval is less than in the second and we say again that the change is decreasing with time. Finally in (g) the drop in the second time interval is larger than in the first, we say the change is increasing with time. So what about some examples? Well (f) could be the height of water in a pond when the water is pumped out at a constant rate, (g) could be the height of water in a bucket with a hole in it, or the radiation emitted by a radioactive element. Finally (h) could be the height of a falling ball under gravity. Gravity makes the ball speed-up so the distance covered in the second time interval is greater than the distance covered in the first interval since the ball is moving faster. variable variable variable time time (f) (g) time (h) Many of the graphs you will experience carrying out simulations will be a combination of these elements, here’s a couple of examples. In the first example (i) the variable remains constant over the first time interval, then it increases linearly over the next time interval up to a certain value, and then it remains constant at that value until the end of the simulation. This could be the height of water in your bath when you are in it. After some time the water gets cold, so you open the tap and get some more hot water in (the linear segment) and you sit in the bath for some more time. In the second example (j) the variable remains constant for some time, then at some point starts to increase where the rate of change increases with time. Then the variable remains constant for another period of time after which the variable decreases, and the rate of change decreases with time. This could be the height of water in a river. It remains constant until it starts raining and the rain increases in strength, so the rate of change of water height increases with time. Then it stops raining so the water height does not change for some time. Finally the Environment Agency realises there is a problem and opens up a sluice gate releasing water from the river, so the water height decreases. At first the decrease is large since the flow out of the river is large due to the high pressure of the height of water. As the water height reduces so does this pressure and so the flow is lower. So the rate of change of height gets smaller with time. variable variable (j) (i) time time


