Spann_vibroacoustic_method
advertisement
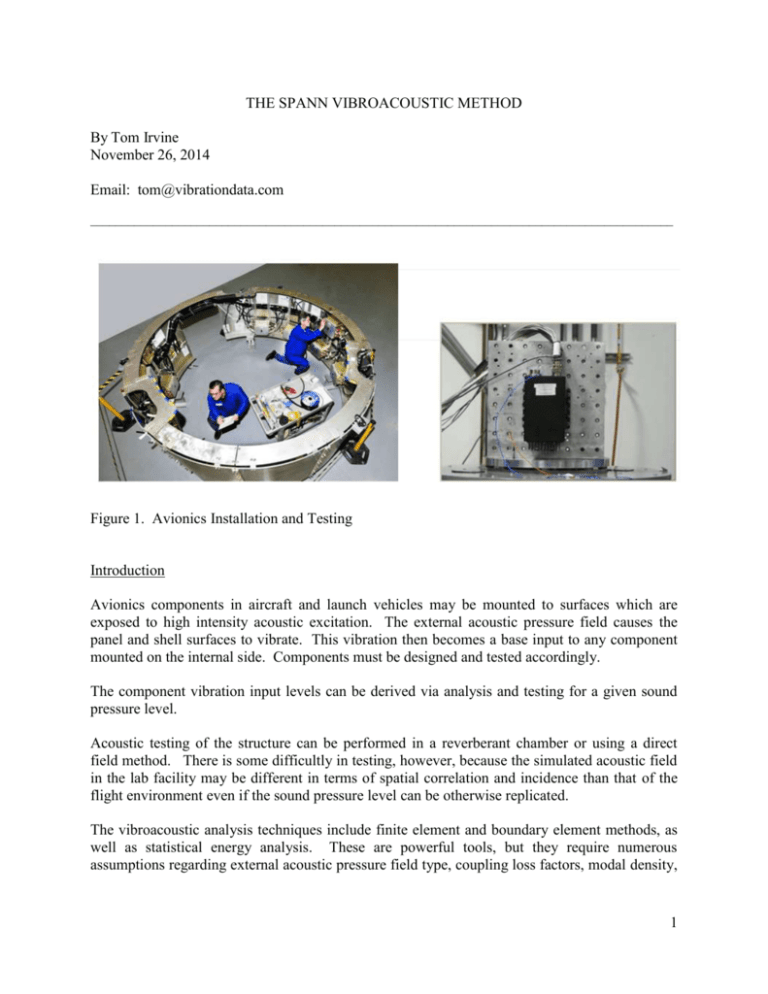
THE SPANN VIBROACOUSTIC METHOD By Tom Irvine November 26, 2014 Email: tom@vibrationdata.com _____________________________________________________________________________________________ Figure 1. Avionics Installation and Testing Introduction Avionics components in aircraft and launch vehicles may be mounted to surfaces which are exposed to high intensity acoustic excitation. The external acoustic pressure field causes the panel and shell surfaces to vibrate. This vibration then becomes a base input to any component mounted on the internal side. Components must be designed and tested accordingly. The component vibration input levels can be derived via analysis and testing for a given sound pressure level. Acoustic testing of the structure can be performed in a reverberant chamber or using a direct field method. There is some difficultly in testing, however, because the simulated acoustic field in the lab facility may be different in terms of spatial correlation and incidence than that of the flight environment even if the sound pressure level can be otherwise replicated. The vibroacoustic analysis techniques include finite element and boundary element methods, as well as statistical energy analysis. These are powerful tools, but they require numerous assumptions regarding external acoustic pressure field type, coupling loss factors, modal density, 1 impedance, radiation efficiency, critical and coincident frequencies, distinguishing between acoustically fast and slow modes, etc. As an alternative, simple empirical methods exist for deriving the structural vibration level corresponding to a given sound pressure level. Two examples are the Franken and Spann techniques. These methods may be most appropriate in the early design stage before hardware becomes available for lab testing and before more sophisticated analysis can be performed. The Franken method is given in References 1 and 2. The Spann equation will be covered in this paper. The Spann method provides a reasonable estimate of the acoustically excited component vibration environments when only the areas exposed to the acoustic environment and mass are known, according to Reference 3. Spann Method This section describes the steps required to derive component vibration test specifications for typical aerospace structures subjected to high-intensity acoustic environments. The application of this prediction method is based on two conditions: 1. Definition of the acoustic environment 2. An adequate general understanding of structure and components to obtain estimates of mass and areas exposed to acoustic excitations Step 1 The method begins with an external one-third octave band sound pressure level (dB). The sound pressure level SPL(fc) for band center frequency fc is converted into a pressure spectral density via the following equation. 10 SPL(fc ) 10 WP (f c ) p ref f c 2 Pa2/Hz (1) where p ref is the zero dB reference pressure (Pa) SPL(fc) is the sound pressure level (dB) f c is the frequency bandwidth (Hz) 2 The typical zero dB reference is p ref 20 Pa 2 pref 20 Pa (2) 2 (3) The RMS pressure in p rms (f c ) each band is 2 SPL(fc ) 10 2 prms (fc ) pref 10 (4) The pressure PSD is thus 2 prms (f c ) WP (fc ) fc (5) The one-third octave bandwidth is fc 0.2316fc (6) Preferred center frequencies are given in Appendix A. Step 2 Estimate area A (m2) of the component and spacecraft support structure supporting the component exposed to acoustic excitation. Step 3 Calculate total mass M (kg) of the component and support structure included in the above estimate in step 2. Step 4 Calculate, at each one-third-octave band frequency, the equivalent acceleration response WA (fc ) (G2/Hz) using the following equation and the values of the pressure power spectral density WP (f c ) (Pa2/Hz), area A (m2) and mass M (kg) calculated in steps 1, 2 and 3. 3 The acceleration power spectral density in one-third octave format for the component base input is 2 A WA (f c ) 2 Q 2 WP (f c ) gM (G2/Hz) (7) where β is recommended as 2.5 per experimental data Q is the amplification factor recommended as 4.5 g is the gravitational constant 9.81 m/sec2 Note that the suggested values for β and Q are taken from Reference 3. Step 5 Iterate steps 2, 3 and 4, using different values of the input parameters to determine maximum WA (fc ) response curve. Example An example is given in Appendix B References 1. Summary of Random Vibration Prediction Procedures, NASA CR-1302, 1969. 2. T. Irvine, Vibration Response of a Cylindrical Skin to Acoustic Pressure via the Franken Method, Revision H, Vibrationdata, 2008. 3. Spacecraft Mechanical Loads Analysis Handbook, ECSS-E-HB-32-26A, Noordwijk, The Netherlands, February 2013. 4 APPENDIX A Preferred One-Third Octave Bands 1/3 Octave Bands Lower Band Limit (Hz) 14.1 Center Frequency(Hz) 16 Upper Band Limit (Hz) 17.8 17.8 20 22.4 22.4 28.2 25 31.5 28.2 35.5 35.5 40 44.7 44.7 50 56.2 56.2 70.8 89.1 63 80 100 70.8 89.1 112 112 141 178 125 160 200 141 178 224 224 282 355 447 562 250 315 400 500 630 282 355 447 562 708 708 891 800 1000 891 1122 1122 1413 1778 2239 2818 3548 1250 1600 2000 2500 3150 4000 1413 1778 2239 2818 3548 4467 4467 5623 7079 8913 11220 14130 17780 5000 6300 8000 10000 12500 16000 20000 5623 7079 8913 11220 14130 17780 22390 5 The previous table is taken from: http://www.engineeringtoolbox.com/octave-bands-frequency-limits-d_1602.html Note the following relationships. fl Lower band frequency fc Band center frequency fu Upper frequency fc f u fl (A-1) f u 21/6 fc (A-2) fl fc / 21/6 (A-3) For two consecutive bands, fc , i1 fc , i (A-4) The preferred frequencies in the previous table approximately satisfy this set of formulas. 6 APPENDIX B Example Figure B-1. An avionic box is mounted to a surface with the following parameters. β 2.5 Q 4.5 M 10 lbm A 400 in^2 The external mounting surface is subjected to the sound pressure level in Figure B-1. 7 Figure B-2. The resulting acceleration PSD is shown in Figure B-2. This would be the base input for the avionics component. 8

