ELECTRONIC SUPPLEMENTARY MATERIAL Table S1 Chemical
advertisement
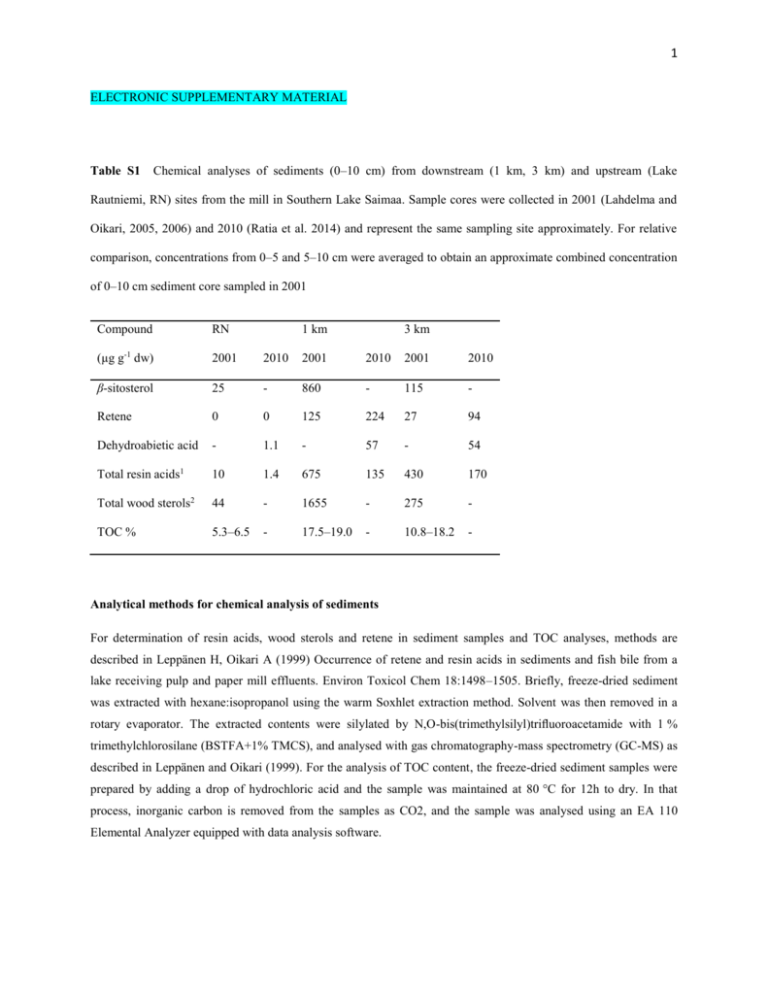
1 ELECTRONIC SUPPLEMENTARY MATERIAL Table S1 Chemical analyses of sediments (0–10 cm) from downstream (1 km, 3 km) and upstream (Lake Rautniemi, RN) sites from the mill in Southern Lake Saimaa. Sample cores were collected in 2001 (Lahdelma and Oikari, 2005, 2006) and 2010 (Ratia et al. 2014) and represent the same sampling site approximately. For relative comparison, concentrations from 0–5 and 5–10 cm were averaged to obtain an approximate combined concentration of 0–10 cm sediment core sampled in 2001 Compound RN 1 km 3 km (µg g-1 dw) 2001 2010 2001 2010 2001 2010 β-sitosterol 25 - 860 - 115 - Retene 0 0 125 224 27 94 Dehydroabietic acid - 1.1 - 57 - 54 Total resin acids1 10 1.4 675 135 430 170 Total wood sterols2 44 - 1655 - 275 - TOC % 5.3–6.5 - 17.5–19.0 - 10.8–18.2 - Analytical methods for chemical analysis of sediments For determination of resin acids, wood sterols and retene in sediment samples and TOC analyses, methods are described in Leppänen H, Oikari A (1999) Occurrence of retene and resin acids in sediments and fish bile from a lake receiving pulp and paper mill effluents. Environ Toxicol Chem 18:1498–1505. Briefly, freeze-dried sediment was extracted with hexane:isopropanol using the warm Soxhlet extraction method. Solvent was then removed in a rotary evaporator. The extracted contents were silylated by N,O-bis(trimethylsilyl)trifluoroacetamide with 1 % trimethylchlorosilane (BSTFA+1% TMCS), and analysed with gas chromatography-mass spectrometry (GC-MS) as described in Leppänen and Oikari (1999). For the analysis of TOC content, the freeze-dried sediment samples were prepared by adding a drop of hydrochloric acid and the sample was maintained at 80 °C for 12h to dry. In that process, inorganic carbon is removed from the samples as CO2, and the sample was analysed using an EA 110 Elemental Analyzer equipped with data analysis software. 2 Isolation of RNA, RNA quality and reverse transcription Total RNA was extracted from homogenized pooled fish samples (15 animals with total weight ca. 16 mg) using the Tri Reagent (Molecular Research Center, Inc.) according to manufacturer’s instructions, and the quality and quantity were determined on a NanoDrop ND-1000 UV-visible spectrophotometer. Absorbance measurements including 260:280 ratios (1.8 to 2.0) and the additional 260:230 > 260:280 ratios indicated a secondary measure of nucleic acid purity. The integrity of RNA was also verified using the Agilent RNA 6000 Nano Assay Protocol with an Agilent 2100 Bioanalyzer (Waldbronn, Germany). RNA integrity number (RIN, 1–10) generated for analyzed samples was checked within range 7–10 for all samples. The total RNA extracted was first DNase-treated and then reverse transcribed into cDNA using iScript cDNA synthesis kit (Bio-Rad, USA), and the cDNA templates were diluted ten times for use in real time PCR assays. Prior to use, the cDNA samples were always checked for purity by absorbance ratios 260:280 (>1.8), and stored at -20°C until use. Real time PCR Real-time PCR was performed using iQ SYBR Green supermix (Bio-Rad, USA) and run on a Bio-Rad CFX96™ real-time PCR detection system (Bio-Rad, USA). The primer pair sequences were checked with the program Mfold (http://mfold.bioinfo.rpi.edu/cgi-bin/dna-form1.cgi) to predict the potential for amplicon secondary structures that may prevent efficient amplification. To evaluate qPCR efficiency, amplification efficiency with standard curve analysis (PCR efficiency, β-actin 99 %, elf1a 101 %, cyp1a 96 %, cyp19a1b 98 %, vtg1 97 %; slope, -3.1 to -3.6; R2 > 0.98) was performed, and optimization of qPCR reactions and protocol was carried out. The qPCR reaction mix was optimized for a 25 µL reaction mix consisting of 12.5 µL of SYBR green supermix, 2.5 µL of each of the primer pairs (200 nM), 2.5 µL sterile water, and 5 µL of cDNA template (100 ng µL–1). The PCR protocol comprised 10 min polymerase activation at 95 °C, followed by 40 cycles of 30 sec at 95 °C, and 30 sec at 60 °C. Each sample was assayed in duplicate, and assays requiring multiple runs included inter-run calibrators (IRCs) on each of the plates to facilitate sample maximization and restricting reference gene reactions to a single plate. The inter-run calibration was performed to correct for variation, allowing comparison between plates within the same analysis. Quantification of every gene was confirmed with minus RT control.
