Appendix A: ALMA Cycle 2 Capabilities
advertisement
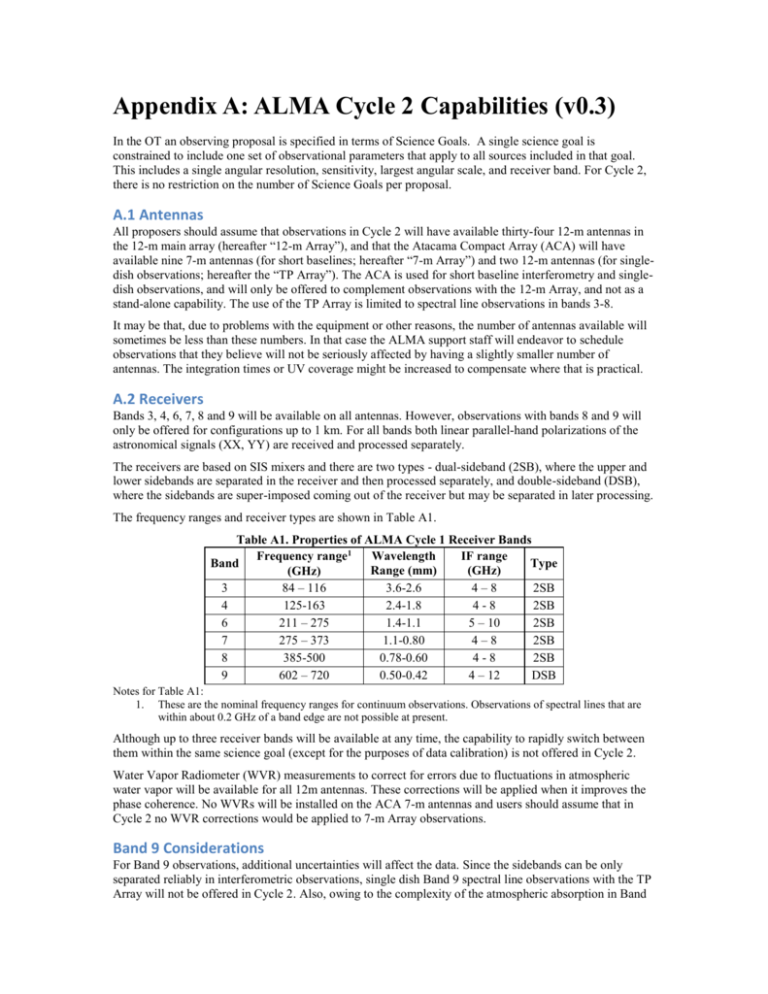
Appendix A: ALMA Cycle 2 Capabilities (v0.3) In the OT an observing proposal is specified in terms of Science Goals. A single science goal is constrained to include one set of observational parameters that apply to all sources included in that goal. This includes a single angular resolution, sensitivity, largest angular scale, and receiver band. For Cycle 2, there is no restriction on the number of Science Goals per proposal. A.1 Antennas All proposers should assume that observations in Cycle 2 will have available thirty-four 12-m antennas in the 12-m main array (hereafter “12-m Array”), and that the Atacama Compact Array (ACA) will have available nine 7-m antennas (for short baselines; hereafter “7-m Array”) and two 12-m antennas (for singledish observations; hereafter the “TP Array”). The ACA is used for short baseline interferometry and singledish observations, and will only be offered to complement observations with the 12-m Array, and not as a stand-alone capability. The use of the TP Array is limited to spectral line observations in bands 3-8. It may be that, due to problems with the equipment or other reasons, the number of antennas available will sometimes be less than these numbers. In that case the ALMA support staff will endeavor to schedule observations that they believe will not be seriously affected by having a slightly smaller number of antennas. The integration times or UV coverage might be increased to compensate where that is practical. A.2 Receivers Bands 3, 4, 6, 7, 8 and 9 will be available on all antennas. However, observations with bands 8 and 9 will only be offered for configurations up to 1 km. For all bands both linear parallel-hand polarizations of the astronomical signals (XX, YY) are received and processed separately. The receivers are based on SIS mixers and there are two types - dual-sideband (2SB), where the upper and lower sidebands are separated in the receiver and then processed separately, and double-sideband (DSB), where the sidebands are super-imposed coming out of the receiver but may be separated in later processing. The frequency ranges and receiver types are shown in Table A1. Table A1. Properties of ALMA Cycle 1 Receiver Bands Frequency range1 Wavelength IF range Band Type Range (mm) (GHz) (GHz) 3 84 – 116 3.6-2.6 4–8 2SB 4 125-163 2.4-1.8 4-8 2SB 6 211 – 275 1.4-1.1 5 – 10 2SB 7 275 – 373 1.1-0.80 4–8 2SB 8 385-500 0.78-0.60 4-8 2SB 9 602 – 720 0.50-0.42 4 – 12 DSB Notes for Table A1: 1. These are the nominal frequency ranges for continuum observations. Observations of spectral lines that are within about 0.2 GHz of a band edge are not possible at present. Although up to three receiver bands will be available at any time, the capability to rapidly switch between them within the same science goal (except for the purposes of data calibration) is not offered in Cycle 2. Water Vapor Radiometer (WVR) measurements to correct for errors due to fluctuations in atmospheric water vapor will be available for all 12m antennas. These corrections will be applied when it improves the phase coherence. No WVRs will be installed on the ACA 7-m antennas and users should assume that in Cycle 2 no WVR corrections would be applied to 7-m Array observations. Band 9 Considerations For Band 9 observations, additional uncertainties will affect the data. Since the sidebands can be only separated reliably in interferometric observations, single dish Band 9 spectral line observations with the TP Array will not be offered in Cycle 2. Also, owing to the complexity of the atmospheric absorption in Band 9, calibration will be compromised. ACA 7-m Array Band 9 observations are further compromised – the lack of Water Vapor Radiometers means that rapid atmospheric phase correction will not be available, and its smaller collecting area will limit the network of available calibrators; in particular bright calibrators will be sparse at these high frequencies. All of these factors will affect imaging at Band 9 during Cycle 2 and will in particular limit the achievable dynamic range with the ACA 7-m Array. Spectral Dynamic ranges up to 500 are offered for this Band in Cycle 2 (see Section A8.1 for details) A.3 12-m Array Configurations The antennas of the Cycle 2 12-m Array can be staged into distinct configurations intended to smoothly transition from the most compact (with maximum baselines of ~160 m) up to the most extended (maximum baselines of ~1.5 km, offered for bands 3, 4, 6 and 7; of ~ 1km for bands 8, 9). Seven configurations have been defined to represent the possible distribution of 34 antennas over this range of maximum baselines. The detailed properties of these configurations are given in Chapter 7 of the Cycle 2 Technical Handbook. For all observations, the relevant parameters used by the OT in deciding the required Array components for the representative frequencies of a given project are: (1) the Maximum Angular Scale that can be imaged without the need for the ACA (set by the shortest baseline of the most compact 12-m Array configuration); (2) the coarsest resolution obtainable with the 12-m Array (set by twice the resolution of the most compact 12-m Array configuration to avoid significant loss of sensitivity); and (3) the finest resolution obtainable (set by the longest baseline of the most extended 12-m Array configuration). These quantities are given in Table A2. Sources with a user-specified “Largest Angular Scale” (LAS) larger than the Maximum Angular Scale listed in this table will require the addition of ACA observations. Observations with a requested angular resolution either coarser or finer than the values listed in Table A2 (scaled to the appropriate frequency) are not allowed. Values that are inconsistent with any Cycle 2 limitations for the parameters above, will result in a warning or a validation error in the OT. Table A2. Maximum Angular Scale1 and Coarsest and Finest Angular Resolutions1 for the Cycle 2 12-m Array configurations Maximum Coarsest allowed Finest achievable Frequency Angular Scale2,3,4 angular resolution2,3,5 Angular resolution2,3,6 (GHz) with no ACA (arcsec) (arcsec) (arcsec) 100 25 7.5 0.41 150 17 5.0 0.27 230 11 3.3 0.18 345 7.2 2.2 0.12 460 5.4 1.6 0.12 650 3.8 1.2 0.09 Notes for Table A2: 1. See Chapter 7 of the Technical Handbook for relevant equations and detailed considerations. 2. Computation for source at zenith. For sources transiting at lower elevations, the North-South angular measures will increase as the sin(ELEVATION). 3. All angular measures scale inversely with observed sky frequency. 4. “Maximum Angular Scale” is the largest angular scale that can be observed effectively. It is set by the shortest baseline of the most compact 12-m Array (14 meters). 5. Coarsest allowed angular resolution is twice the resolution of the most compact 12-m Array configuration (maximum baseline of 166 meters). 6. Finest achievable angular resolution is set by the resolution of the most extended 12-m Array configuration (1.5 km for bands 3-7, and 1.0 km for bands 8 & 9), assuming uniform weighting. A.4 ACA The ACA in Cycle 2 is composed of nine 7-m antennas for the 7-m Array and two 12-m antennas for the TP Array. Two 7-m Array configurations will be offered in Cycle 2, one compact for regular observations and another with significantly less antennas packed close together for observations of objects that transit at low elevations. Both configurations render similar performances, and the decision on which to use for a given project is at the discretion of the Observatory. For more on the ACA see Chapter 7 of the Cycle 2 Technical Handbook. The TP Array is used to recover, at low angular resolution, all the angular scale information up to the size of the mapped areas. For Cycle 2, the TP Array can only be used for spectral line observations (not continuum) in bands 3-8. No TP Array Band 9 observations are offered for this Cycle. This means that angular scales greater than those listed in Table A3 cannot be recovered for band 9 or continuum observations. For projects that require both 7-m Array and TP-Array, observations will be carried out in parallel as much as possible to optimize the use of the ACA. TABLE A3. Maximum Angular Scales for ACA 7-m observations Maximum Angular Frequency Scale1,2,3 with 7-m Array (GHz) (arcsec) 100 42 150 28 230 18 345 12 460 9.1 650 6.4 1. 2. 3. Computation for source at zenith. For sources transiting at lower elevations, the North-Source angular measures will increase as the sin(ELEVATION). All angular measures scale inversely with observed sky frequency. “Maximum Angular Scale” is the largest angular scale that can be observed effectively. It is set by the shortest baseline of the ACA (8.9 meters). See Chapter 7 of the Technical Handbook for details. Observations with the 12-m Array and the ACA will be conducted independently, and the data from the different arrays will be calibrated separately and combined during data reduction. A.5 Time Estimates for Multi-configuration Observations Images that obtain a high fidelity over a broad range of angular scales require observations taken with a continuous range of antenna baseline separations. The user-requested angular resolution () determines the most extended 12-m configuration that is needed (up to the “finest allowed angular resolution” listed in Table A2), and the user-requested sensitivity plus calibration requirements determine the amount of observing time needed in this configuration (textended). For point sources, only a single configuration is sufficient to reach the user-requested resolution. For non-point sources, the OT uses the user-provided largest angular scale (LAS) and angular resolution to determine all the array components needed. Interested users should refer to Chapter 7 of the Technical Handbook for a table of the array combinations needed to recover various angular scale ranges. The time needed for the different Array components (including calibrations), referenced to the time needed in most extended 12-m configuration, is 4textended for the TP Array, 2textended for the 7-m Array and 0.5textended for a more compact 12-m (if needed). The total time required by a proposal is estimated in the OT by adding the expected observing times for both the 12-m array and ACA. For Cycle2, this total time must be less than 100hrs. Table A3 below lists the total observing time estimates for the different array combination possibilities offered in Cycle 2. For this computation, the fact that 7-m Array and TP Array observations will be done, as much as possible, in parallel, has been taken into account.. Table A3: Total Time multiplication factors for multi-array observations Total Time estimate Array Components needed (based on and LAS) Single 12-m Array configuration 1.0 textended Two 12-m Array configurations 1.5 textended Single 12-m Array configuration and 7-m Array 3.0 textended Two 12-m Array configurations and 7-m Array 3.5 textended One 12-m Array configuration and 7-m Array and TP Array (spectral line, bands <9) Two 12-m Array configurations and 7-m Array and TP Array (spectral line, bands <9) 5.0 textended 5.5 textended The fixed time ratios adopted in Table A3 were selected to get good imaging performance between the different array components (see Chapter 7 of the Technical Handbook for more details). However, given the many fewer baselines in the 7-m Array compared to the 12-m Array, good imaging may not be obtainable with short observations (estimated ACA times of less than ~1hr). For such observations, users may want to use the OT option to enter a time duration longer than that estimated by the OT on sensitivity grounds alone (e.g. based on simulations or other arguments). Based on LAS the OT will advise whether the ACA is needed for a given project. If the user chooses not to follow this recommendation, he/she must explain this in their technical justification. A.6 Spectral Capabilities A.6.1 Spectral windows, Bandwidths and Resolutions The ALMA IF system provides up to four basebands that can be independently placed within the receiver sidebands. For 2SB receivers (bands 3-8 – see Table A1) the number of basebands that can be placed within a sideband is 0, 1, 2, or 4. For DSB receivers (Band 9), there is no such restriction. The 12-m Array uses the 64-input correlator, while the 7-m and TP Arrays use the 16-input ACA correlator. Both correlators offer the same spectral set-ups. They operate in two main modes: Time Division Mode (TDM) and Frequency Division Mode (FDM). TDM provides modest frequency resolution and produces a relatively compact data set. It is used for continuum observations or for spectral line observations that do not require high spectral resolution. FDM gives high spectral resolution and produces much larger data sets. It is used for observations of spectral lines in all sources except those with very wide lines. Six FDM set-ups are available with the bandwidths and spectral resolutions described in Table A5. Cycle 2 allows the data to be pre-smoothed in the correlator by averaging (or binning) spectral channels in powers of 2. This allows one to reduce the data rate without increasing the sampling integration time (see Ch. 4 of the Technical Handbook for more information). In Cycle 2, the maximum data rate is 60 MB/s, with the expected average of 6 MB/s. If the spectral setup ends up with a data rate that is significantly higher than the expected mean of 6 MB/s, the user will need to technically justify this. For each baseband, the correlator resources can be divided across a set of spectral "windows" (SPWs) that can be used simultaneously and positioned independently. For Cycle 2 up to four spectral windows per baseband are allowed. A fraction of the correlator resources are assigned to each spectral window, which sets the number of channels and bandwidth of the spectral window. The sum of the correlator resources spread across all spectral windows must be less than or equal to one. As such, the addition of multiple spectral windows in a baseband does not increase the data rate. Different correlator modes can be specified for each baseband, but all SPWs within a given baseband must use the same correlator mode. For example, a high resolution FDM mode can be used for spectral line observations in one baseband (with up to 4 differently placed FDM spectral windows), while the other three basebands can be used for continuum observations using the low resolution TDM mode. And while each SPW within a baseband must use the same correlator mode, they can each be assigned a different fraction of the correlator resources and each use a different spectral averaging factor, providing a broad range of simultaneously observed spectral resolutions and bandwidths. SPWs can overlap in frequency, although the total continuum bandwidth for calculating the sensitivity is set by the total independent continuum bandwidth. Table A5. Properties of ALMA Cycle 2 Correlator Modes, dual-polarization operation1,2 Bandwidth3 Channel Spectral Number of Correlator (MHz) 20003 1875 938 469 234 117 58.6 spacing4 (MHz) 15.6 0.488 0.244 0.122 0.061 0.0305 0.0153 Resolution4 (MHz) 31.2 0.976 0.488 0.244 0.122 0.061 0.0305 channels 1283 3840 3840 3840 3840 3840 3840 mode TDM FDM FDM FDM FDM FDM FDM Notes for Table A5: 1. These are the figures for each spectral window and for each polarization, using the full correlator resources and no on-line spectral binning. 2. Single-polarization modes are also available, which gives twice the number of channels per SPW, and ½ the channel spacing of the above table. 3. The "Bandwidth" given here is the width of the spectrum processed by the digital correlator. The usable bandwidth in all modes is limited to a maximum of about 1875 MHz by the anti-aliasing filter, which is ahead of the digitizer in the signal path. For TDM modes, the anti-aliasing filter also limits the total bandwidth to about 1875 MHz and the number of channels to about 120. 4. The "Channel Spacing" is the separation between data points in the output spectrum. The spectral resolution i.e. the FWHM of the spectral response function - is larger than this by a factor that depends on the "window function" that is applied to the data in order to control the ringing in the spectrum. For the default function - the "Hanning" window - this factor is 2. See the Technical Handbook for full details. A.6.2 Polarization For Cycle 2, on top of the dual polarizations (XX, YY) and single polarization modes (XX), observations to measure the full intrinsic polarization (XY, YX) of sources will also be offered for TDM observations in bands 3, 6 and 7, with some restrictions. When a Dual Polarization setup is used, separate spectra are obtained for each linear parallel-hand polarization of the input signal. This will give two largely independent estimates of the source spectrum that can be combined to improve sensitivity. In Single Polarization mode, only a single input polarization (XX) is analyzed. For a given resolution, this provide 2 worse sensitivity than the Dual Polarization case, but one can use either a factor two more bandwidth for the same spectral resolution or a factor of two better spectral resolution for the same bandwidth. Single polarization should therefore be used in cases where having a large number of spectral channels is more important than having the best sensitivity. True Polarization continuum measurements will be offered in Cycle 2 only for 12-m Array observations in bands 3, 6 and 7. Sources must be centered and have a user-specified largest angular scale that is less than one-third of the 12-m Array primary beam at the frequency of the planned observations. Observations shall be single-field, but measurements of multiple sources within a 10 degree area on the sky are possible (one field per source; see below). The continuum polarization measurements are offered only for specific frequency settings, as detailed in Table A6. TABLE A6. Fixed frequencies for Polarization Observations SPW1 SPW2 LO1 SPW3 SPW4 Band (GHz) (GHz) (GHz) (GHz) (GHz) 3 90.5 92.5 97.5 102.5 104.5 6 224.0 226.0 233.0 240.0 242.0 7 336.5 338.5 343.5 348.5 350.5 Notes for Table A6: 1. Fixed central frequencies for four TDM spectral windows, each of width 1.875 GHz, and the corresponding LO1 setting. Frequencies were chosen to optimize spectral performance, and they are centered in known low noise and low instrumental polarization tunings of the receivers. It should be noted that full polarization observations require sufficient parallactic angle coverage for calibration (about 3 hours). Science Goals with properties that lead to a total observing time estimate that is less than 3 hours will have the time estimate set to 3 hours to ensure sufficient parallactic angle coverage is obtained. A.7 Source restrictions Sources can be designated by a fixed RA and Dec, or can include moving targets (including the planets, their moons, asteroids and comets). Observations of the Sun, however, are not supported in Cycle 2. Sources are selected in one of two ways: by specifying a single rectangular field, or by specifying one or more source positions, with or without offsets. Each involves some restrictions. The total number of positions in a Science Goal must be less than or equal to 150 and all must lie within 10 degrees. If the ACA is used, these pointings do not count against the 150 pointing Science Goal limit. A.7.1 Single Rectangular Field A rectangular field (also referred to as a mosaic) is specified by a field center, the length, width and orientation of the field, and a single spacing between the pointing centers. Observations are conducted using the “mosaic” observing mode. This repeatedly cycles through all the pointings in the mosaic so that the imaging characteristics across the map are similar. One rectangular field is allowed per Science Goal. A single mosaic can have up to 150 pointings and must be done in a single frequency set-up. If ACA observations are requested as part of a mosaic, then a corresponding 7-m Array mosaic will also be observed. If these are spectral line observations, the full mosaic area can also be covered by the TP Array using On-The-Fly mapping. The OT will set up a uniform mosaic pattern based on a user-specified pointing separation, and will calculate the time to reach the required sensitivity considering any overlap. Non-Nyquist spatial samplings are allowed, but must be fully justified in the proposal. If the position separations are not too large, then the interferometric data are combined in post-processing to produce a single image. Mosaics in different Science Goals will not be combined during post-processing. A.7.2 Multiple Sources If a user does not wish to specify a rectangular field, they may include in a single Science Goal a mixture of sources and offsets, provided that: (1) They are not separated by more than 10 degrees on the sky, (2) They can be observed with one spectral setup (relative placement and properties of spectral windows), (3) They can be observed with no more than five separate frequency settings that all fall within the same receiver band, (4) The sum over all sources, offsets, and frequency settings is less than or equal to 150. Offsets can be specified for all sources within a science goal, but the 150 pointing limit applies. If ACA observations are requested for the science goal, then the corresponding ACA observations will be obtained for each source. Sets of offsets are designated either as a “Custom Mosaic” or a “Pointing Pattern”. The former are observed using the “mosaic” observing mode and can be separated by no more than one primary beam. The interferometric data will be combined in post-processing to produce a single image. The later are not observed as mosaics, do not have a separation constraint (apart from the 10deg separation limit of a science goal), and will not be combined to produce a single image. For offsets, the OT does not consider the effect of overlapping pointings; users must take this into account when specifying the required sensitivity. A.7.3 Spectral Scan Mode Proposers that wish to carry out spectral surveys or redshift searches can do so using the “Spectral Scan” option in the OT to automatically set up a set of contiguous spectral windows to cover a specified frequency range, provided that: i) ii) All targets must not be separated by more than 10deg on the sky, No more than 5 frequency tunings are used, all in the same Band, iii) The sum, for all targets, of the number of separate tunings required per target does not exceed 150 (i.e., the maximum number of targets for a 5 tuning for all SG is 30). A.8 Calibration Absolute amplitude calibration will be based on observations of objects of known flux, principally solar system objects. It is expected that the accuracy of the absolute amplitude calibration relative to these objects will be better than 5% for Band 3 and 4. Calibration in the higher frequency bands is likely to be less accurate. The goals are: better than 10% in bands 6 and 7. Calibration at Bands 8 and 9 will be challenging even at the 20% level owing to the double sideband nature of the total power observations in that band (sec A.2). The ALMA Observatory has adopted a set of strategies to achieve good calibration of the data (see Chapter 10 of the Technical Handbook). Requests for changes in these strategies will only be granted in exceptional circumstances and must be fully justified by the requester. Some flexibility exists in choosing the actual calibrator sources. The default option is automatic calibrator selection by the system. If users opt for providing their own calibrators, justification will be needed. This may result in decreased observing efficiency and/or calibration accuracy. A.8.1 Bandpass Accuracy The detailed shape of the spectral response of the Arrays during observations depends on many factors. This shape particularly affects projects that intend to observe spectral features that cover a significant fraction of a SPW, and/or study spectral features with small contrast with respect to a strong continuum. It has been determined that, for Cycle 2, projects that require spectral response accuracies, per observation execution, of up to 1000 for ALMA Bands 3,5,6 and 500 for Bands 8 and 9 are feasible. Requests for higher accuracies may be the grounds for rejection of the proposal. A.8 ToO and Time-Constrained Observations Observations of ToO, monitoring and Time-Constrained projects (with stringent ) will be offered in Cycle 2 with a few restrictions. Observations must be in only one 12-m Array configuration, Triggering of observations with less than 2-week’s notice are not guaranteed to be carried out.

