Statistical parameters
advertisement
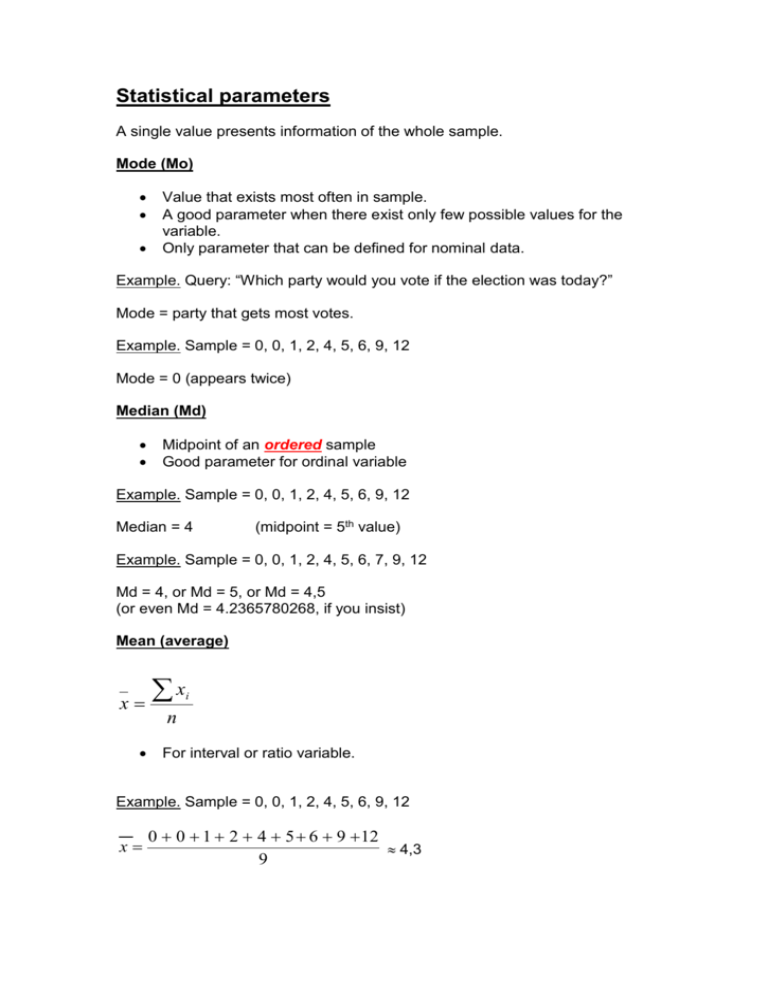
Statistical parameters A single value presents information of the whole sample. Mode (Mo) Value that exists most often in sample. A good parameter when there exist only few possible values for the variable. Only parameter that can be defined for nominal data. Example. Query: “Which party would you vote if the election was today?” Mode = party that gets most votes. Example. Sample = 0, 0, 1, 2, 4, 5, 6, 9, 12 Mode = 0 (appears twice) Median (Md) Midpoint of an ordered sample Good parameter for ordinal variable Example. Sample = 0, 0, 1, 2, 4, 5, 6, 9, 12 Median = 4 (midpoint = 5th value) Example. Sample = 0, 0, 1, 2, 4, 5, 6, 7, 9, 12 Md = 4, or Md = 5, or Md = 4,5 (or even Md = 4.2365780268, if you insist) Mean (average) x x i n For interval or ratio variable. Example. Sample = 0, 0, 1, 2, 4, 5, 6, 9, 12 x 0 0 1 2 4 5 6 9 12 4,3 9 Range [Min ; Max] Example. Range of car speeds during 12:00 – 13:00 in a certain checkpoint was 43 km/h – 109 km/h Range width Max – Min Example (Previous one) Range width = 109 – 43 = 66 km/h Percentage points p% -point: p% of values are BELOW p%-point. Based on number of values only! Example. 5% -point (or p5%) : 5% of values are below p5% and 95% of values are above p5%. if n = 200 then 10 values would be below p5% and 190 values would be above p5% . Quartiles: Q1 = 25% point Q3 = 75% point Deciles D1 = 10% point D2 = 20% point ∙∙∙ D9 = 90% point Standard deviation (s) Close to “Average of distances between a single value and Mean” s x i x 2 n 1 Without mean: x x n 2 i 2 s i n 1 “n-1” is used as divider to prevent us giving too small deviation (based on a abnormally clean sample) Two cases, when n can be used: A: sample size ≤ 30 B: when we study the population (instead a sample) Parameters with Excel Mode =MODE(array) Median =MEDIAN(array) Mean =AVERAGE(array) Percentile (Pn%) =PERCENTILE(array;p%) Lowest value =MIN(array) Highest value =MAX(array) Standard deviation =STDEV(array) =STDEVP(array) [divider = n-1] [divider = n]
