TEP
4.1.09
-01
Characteristic curves of a solar cell
Related Topics
Semi-conductor, p-n junction, energy-band diagram, Fermi characteristic energy level, diffusion potential,
internal resistance, efficiency, photo-conductive effect, acceptors, donors, valence band, conduction
band.
Principle
To measure the current-voltage characteristics of a solar cell at different light intensities, the distance between the light source and the solar cell is varied. Moreover, the dependence of no-load voltage on temperature is determined.
Equipment
1
1
1
1
1
1
1
1
2
2
Solar battery, 4 cells, 2.55 cm
Thermopile, molltype
Universal measuring amplifier
Rheostat, 330 Ohm, 1.0 A
Lamp socket E27, mains conn.
Filament lamp, 220 V/120 W, w. refl.
Hot-/Cold air blower, 1700 W
Meter scale, demo, l = 1000 mm
Tripod base -PASSBarrel base -PASS-
06752.04
08479.00
13626.93
06116.02
06751.00
06759.93
04030.93
03001.00
02002.55
02006.55
2
2
1
1
2
1
2
1
3
2
Support rod -PASS-, square, l = 250 mm
Right angle clamp -PASSPlate holder
Universal clamp
Bench clamp -PASSGlass pane, 1501004 mm, 2 off
Digital multimeter
Lab thermometer, -10...+100°C
Connecting cord, l = 500 mm, red
Connecting cord, l = 500 mm, blue
02025.55
02040.55
02062.00
37715.00
02010.00
35010.10
07134.00
38056.00
07361.01
07361.04
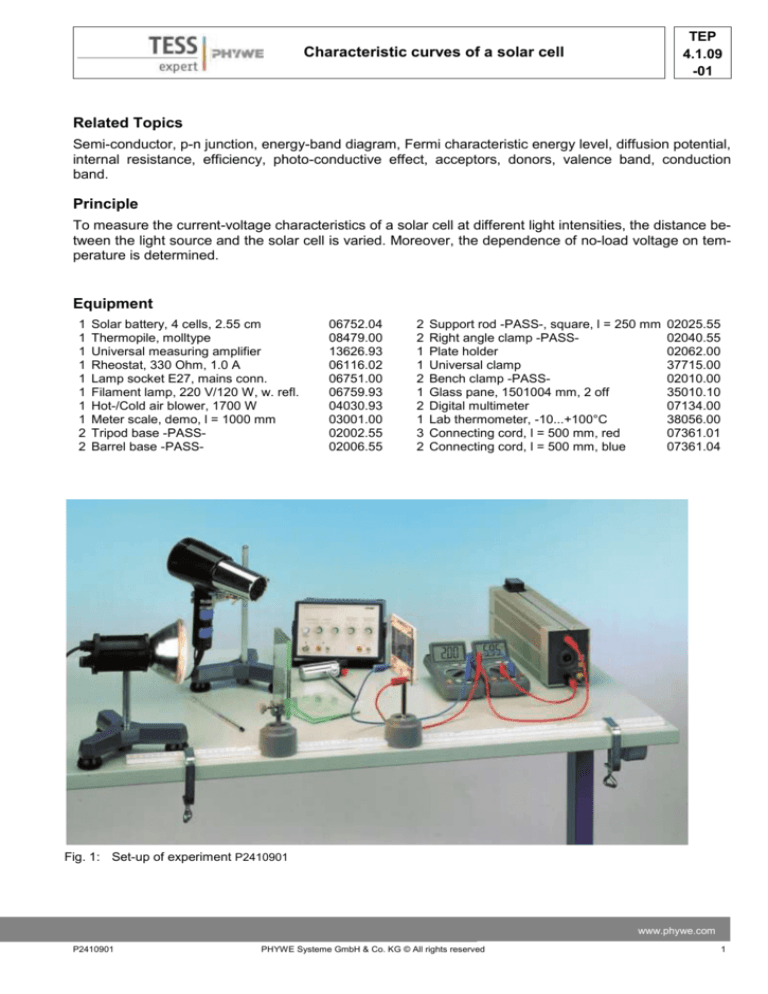
Fig. 1: Set-up of experiment P2410901
www.phywe.com
P2410901
PHYWE Systeme GmbH & Co. KG © All rights reserved
1
TEP
4.1.09
-01
Characteristic curves of a solar cell
Tasks
1. Measure the short-circuit current and no-load voltage at different light intensities and plot the current-voltage characteristic at different light intensities.
2. Estimate the dependence of no-load voltage and short-circuit current on temperature.
3. Plot the current-voltage characteristic under different operating conditions: cooling the equipment
with a blower, no cooling, shining the light through a glass plate.
4. Determine the characteristic curve when illuminating by sunlight.
Set-up and Procedure
-
The thermopile only measures the light of the
lamp but the solar cell also detects the diffused
light coming from reflections on the bench top.
Therefore, it is recommended to cover the bench
with a black cloth or piece of black card to suppress the diffused light.
-
The experimental set-up is as shown in Fig. 1.
The glass plate is only needed for task 3.
-
Do the electrical connections as in Fig. 2
Fig. 2: Circuit for measuring the current-voltage charac-
Task1
teristic.
The light intensity is varied by varying the distance
between the light source and the solar cell. First of
alle, measure the light intensity with the thermopile and amplifier with the equipment at different distances from the light source. (Note: the maximum output voltage of the amplifier is 10 V). The inlet aperture
marks the position of the thermopile. The distance between the lamp and the thermopile should be at
least 50 cm, since the angular aperture of the thermopile is only 20°.
To suppress the influence of the temperature on the characteristics of the solar cell, keep it at room temperature with the aid of the cold air blower during the experiment.
Task 2
To demonstrate the temperature effect, blow hot air over the solar cell and measure the temperature directly in front of it with a thermometer. Do not touch the cell as its thin p-layer can easily be damaged.
We recommend separating the lamp and solar cell more than 50 cm, because in shorter distances the
temperature rise caused by radiation could falsify the measurement. Measure the noload voltage and the
short-circuit current.
Task 4
- The characteristics of the solar cell should be measured in sunlight also if possible; in this case both
direct and diffused light are involved.
- The thermophile is used again to determine the relationship between the short-circuit current and the
light intensity, although it measures only direct light because of its small angular aperture. For comparative purposes, therefore, we must support a black cardboard tube about 20 cm long in front of the
solar cell to screen it from the diffused light. It is important that the thermopile and the solar cell are
pointing directly into the sun.
2
PHYWE Systeme GmbH & Co. KG © All rights reserved
P2410901
TEP
4.1.09
-01
Characteristic curves of a solar cell
Theory and evaluation
Pure silicon is deliberately ‘impurified’ (doped) with
tri- and pentavalent impurity atoms to make a p- or
n-type semi-conductor. If we put a p-and n-type
crystal together we get a junction (pn-junction, Fig.
3) whose electrical properties determine the performance of the solar cell.
In equilibrium (with no external voltage) the Fermi
characteristic energy level EF will be the same
throughout. Because of the difference in the concentrations of electrons and holes in the p- and nregions, electrons diffuse into the p-region and
holes into the n-region. The immobile impurity atoms create a space charge-limited current region;
the diffusion current and the field current offset
one another in equilibrium.
The diffusion potential UD in the pn-junction depends on the amount of doping and corresponds
to the original difference between the Fermi energy levels of the separate p- and n-regions.
The distance between the valence band and the
conduction band in silicon at room temperature is
Fig. 3: pn-junction in the energy-band diagram – acceptors, + donors, UD is the diffusion potential, EF is the
Fermi characteristic energy level, and e is the elementary charge.
E = 1.1 eV
For silicon, the diffusion potential is
UD = 0.5 to 0.7 V.
If light falls on the pn-junction, the photons create
electronhole pairs separated by the space charge.
The electrons are drawn into the n-region and the
holes into the p-region. Photons are absorbed not Fig. 4: Construction of a silicon solar cell.
only in the pn-junction but also in the p-layer
above it. The electrons produced are minority carriers in those areas: their concentration is greatly reduced by recombination and with it their efficiency.
The p-layer must therefore be sufficiently thin for the electrons of diffusion length LE to enter the n-layer.
LE >> t,
where t = thickness of p-layer.
If g is the number of electron-hole pairs produced per unit area and of a voltage U is applied across the
pn-junction, a stream of electrons and holes of density
𝑛0 𝐷𝑒 𝑡
𝐿2 𝑒
𝑖 = 𝑒 ∙ (e𝑒𝑈⁄𝑘𝑇 − 1)(
+
𝑝0 𝐷ℎ
)−
𝐿ℎ
𝑒𝑔
(1)
is produced, where e is the elementary charge, k is Boltzmann’s constant, T is the temperature, L is the
diffusion length of electrons and holes, D is the diffusion constant for electrons and holes, n0 and p0 are
equilibrium concentrations of the minority carriers.
The short-circuit current density (U = 0)
www.phywe.com
P2410901
PHYWE Systeme GmbH & Co. KG © All rights reserved
3
TEP
4.1.09
-01
Characteristic curves of a solar cell
𝑖𝑠 = −𝑒 ∙ 𝑔
(2)
is proportional to the intensity of the incident light at fixed temperature. g becomes very slightly greater (less than 0.01 %/K)
as the temperature rises.
The voltage U can become as high as the diffusion potential UD
but no higher. As the temperature rises the no-load voltage decreases typically by –2.3 mV/K, since the equilibrium concentrations n0 and p0 increase with the temperature:
∆𝐸
𝑛0 ~ e−2𝑘𝑇
Task 1:
For this task, it is assumed that all the light entering the aperture
(dia. 2.5 cm) reaches the measuring surface. The sensitivity is
0.16 mv/mW. Plotting the light intensity J over the distance s
gives a straight line. By extrapolating the straight line we can determine the intensity at distances s ≤50 cm.
Fig 6 shows the relationship between the light intensity and the
short-circuit current and no-load voltage (Fig. 6).
Fig. 5: Light intensitiy J at distances s normal
The solar battery which consists of four cells connected in series to the light source.
thus has a maximum no-load voltage of 2 V. The shortcircuit current is proportional to the light intensity.
𝐼𝑠 = 1.84 ∙ 10−4 𝐴/𝑊𝑚−2 ∙ 𝐽
The current-voltage characteristic at different light intensities J is shown in Fig. 7. The maximum power
output is at the turning points on the curves (joined by the broken line; Fig. 7) at which the load resistor
has the same value as the internal resistance Ri of the solar battery.
The internal resistance decreases with increasing light intensity.
If we compare the maximum power output with the incident
power, we obtain an efficiency of approx. 6% (area of solar battery 50 cm2).
Fig. 7: Current-voltage characteristic at different light intensities J.
4
Fig. 6: Short-circuit current Is and no-load voltage
U0 as a function of the light intensity J.
PHYWE Systeme GmbH & Co. KG © All rights reserved
P2410901
Characteristic curves of a solar cell
TEP
4.1.09
-01
Task 2:
Measuring the effect of temperature on U0 and Is the temperature distribution over the hot air area must
be taken into account. The measurements can provide only a rough order of magnitude of this. Measuring the no-load voltage with hot and cold air gave:
∆𝑈0
= −8𝑚𝑉/𝐾
∆𝑇
We thus obtain the value –2 mV/K for one cell.
The change in short-circuit current with the temperature cannot be measured.
Task 3:
A glass plate which absorbs light in the infrared
region can be used to reduce a rise in temperature
of the solar battery. Fig. 8 shows the effect of the
various ‘operating modes’.
Task 6:
Sunlight incident on solar cells produces different
characteristic curves from incandescent light. The Fig. 8: Current-voltage characteristics of the solar battery a) with blower cooling
reason lies in the different spectra of the two light
b) with no blower cooling
sources (Fig. 9). At the same light intensity, sunc) when screened with a glass plate.
light produces a higher shortcircuit current
𝐼𝑠 = 3.04 ∙ 10−4 ∙ 𝐽𝐴/𝑊𝑚−2
Because the infrared region of the spectrum of
sunlight is smaller, the solar cell does not heat up
so much and the measurements with and without
cooling provide the same characteristics for sunlight.
Fig. 9: Spectrum of the sun (T approx. 5800 K) and of
an incandescent lamp (T appox. 2000 K), and the spectral sensitivity of the silicon solar cell.
www.phywe.com
P2410901
PHYWE Systeme GmbH & Co. KG © All rights reserved
5


