Materials and Methods - Springer Static Content Server
advertisement
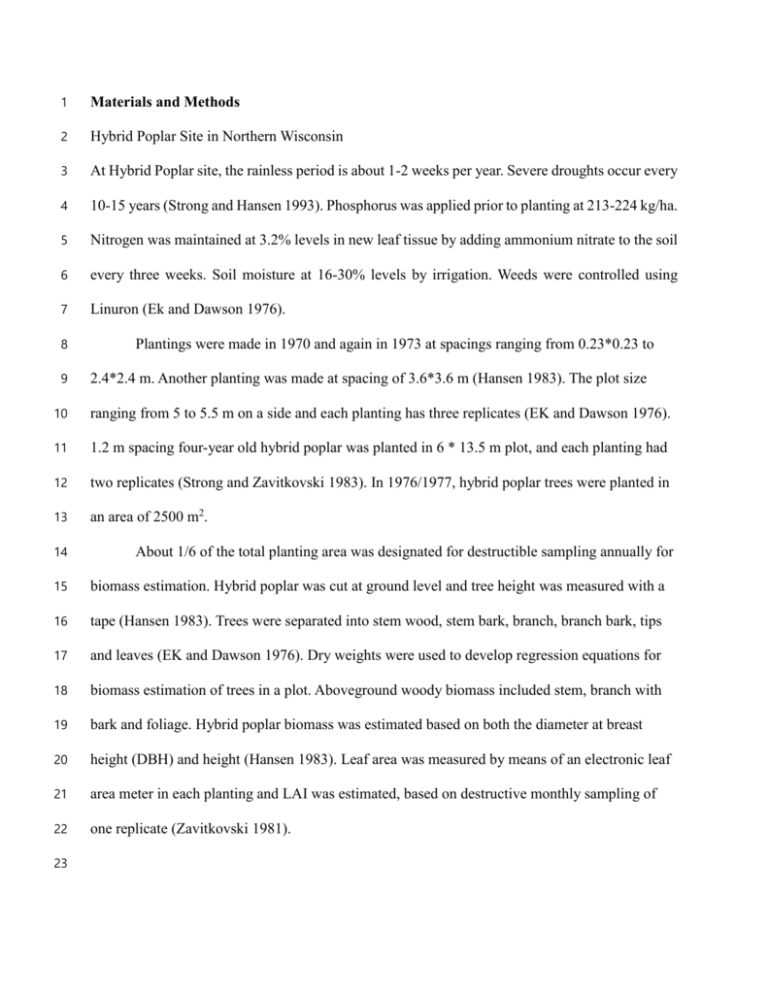
1 Materials and Methods 2 Hybrid Poplar Site in Northern Wisconsin 3 At Hybrid Poplar site, the rainless period is about 1-2 weeks per year. Severe droughts occur every 4 10-15 years (Strong and Hansen 1993). Phosphorus was applied prior to planting at 213-224 kg/ha. 5 Nitrogen was maintained at 3.2% levels in new leaf tissue by adding ammonium nitrate to the soil 6 every three weeks. Soil moisture at 16-30% levels by irrigation. Weeds were controlled using 7 Linuron (Ek and Dawson 1976). 8 9 Plantings were made in 1970 and again in 1973 at spacings ranging from 0.23*0.23 to 2.4*2.4 m. Another planting was made at spacing of 3.6*3.6 m (Hansen 1983). The plot size 10 ranging from 5 to 5.5 m on a side and each planting has three replicates (EK and Dawson 1976). 11 1.2 m spacing four-year old hybrid poplar was planted in 6 * 13.5 m plot, and each planting had 12 two replicates (Strong and Zavitkovski 1983). In 1976/1977, hybrid poplar trees were planted in 13 an area of 2500 m2. 14 About 1/6 of the total planting area was designated for destructible sampling annually for 15 biomass estimation. Hybrid poplar was cut at ground level and tree height was measured with a 16 tape (Hansen 1983). Trees were separated into stem wood, stem bark, branch, branch bark, tips 17 and leaves (EK and Dawson 1976). Dry weights were used to develop regression equations for 18 biomass estimation of trees in a plot. Aboveground woody biomass included stem, branch with 19 bark and foliage. Hybrid poplar biomass was estimated based on both the diameter at breast 20 height (DBH) and height (Hansen 1983). Leaf area was measured by means of an electronic leaf 21 area meter in each planting and LAI was estimated, based on destructive monthly sampling of 22 one replicate (Zavitkovski 1981). 23 1 Cottonwood Site in Western Mississippi 2 The Cottonwood Site is located in the Tennessee Valley Authority (TVA) region, a 276 country 3 area that includes all of Tennessee and portions of 10 contiguous states in the southeastern US, 4 was shown to be viable for cost effective production of SRWCs based on economic analyses 5 (Downing and Graham 1993). Soils were expected to produce high yielding SRWCs. Cottonwood 6 (3-year rotation) is one of the most frequently recommended SRWCs in the southeastern U.S 7 (Joslin and Schoenholtz 1997). 8 Cottonwood cuttings were planted with spacing of 1.2 × 3.6 m in three plots (each plot is 9 about 5000 m2). Cottonwood plantings had three replicates (Thornton et al. 1998). For cottonwood 10 harvest, each row of trees was felled by chainsaw and spread out to decompose. In September of 11 1995, 1996 and Novermber of 1997, aboveground part of three cottonwood trees from each plot 12 were sampled destructively for estimation of aboveground biomass. Mean weight of tree sampled 13 for each year was used to calculate dry-weight aboveground biomass of cottonwood. Tree root was 14 lifted from the sampled trees to determine root biomass. (Pettry et al. 1997, unpublished annual 15 progress report). 16 Yearly LAI and biomass data of hybrid poplar 'Tristis #1' were collected from Hansen 17 (1983) and shown in Tables 10 and 11. 18 Table 10 LAI of 3- to 10-year-old hybrid poplar with various spacings Age LAI Spacing (m) 0.3*0.3 0.6*0.6 1.1*1.1 1.2*1.2 2.0*2.0 Population 1111 278 83 69 25 (trees/100 m2) 3 6.0 5.6 3.8 4.9 0.6 4 6.9 7.1 7.3 5.9 1.6 5 7.3 6.1 5.7 6 8.6 8.7 7.8 8.2 7 8 9 - 2.4*2.4 17 1.6 3.2 6.8 8.4 7.5 5.7 10 1 2 3 - - - - - 8.3 Table 11 Aboveground biomass production of 2- to 10-year-old hybrid poplar with various spacings Age Mean annual biomass production (mt/ha/year) Spacing (m) 0.3*0.3 0.6*0.6 1.1*1.1 1.2*1.2 2.0*2.0 2.4*2.4 3.6*3.6 Population 1111 278 83 69 25 17 8 (trees/100 m2 ) 2 3.7 1.9 1.6 1.1 0.2 0.2 0.1 3 7.0 4.9 3.3 2.3 0.9 0.6 0.3 4 9.0 7.9 6.0 5.1 3.8 2.3 1.0 5 9.9 8.9 6.5 6.8 5.5 3.7 1.7 6 9.6 9.1 4.8 3.2 7 6.5 4.8 8 8.4 5.6 9 9.7 6.2 10 10.4 - 4 5 ALMANAC Model Setup and Management Schedules 6 Daily precipitation and temperature data from 01/01/1970 to 12/31/1982 of Rhinelander WI US 7 weather station (GHCND: USC00477113, Latitude: 45.63, Longitude: -89.42, Elevation: 476m) 8 close to hybrid poplar site, and from 01/01/1995 to 12/31/1997 of Stoneville experimental station 9 WI US (GHCND: USC00228445, Latitude: 33.4, Longitude: -90.92, Elevation: 38.7 m) were 10 downloaded from National Climatic Data Center (NCDC CDO) and used for model setup, base 11 temperature and PHU determination. 12 13 Algorithm and Parameter Changes in the Model 14 The ALMANAC model includes a function to calculate weight of dropping leaves, and then can 15 be used for current aboveground biomass calculation (Equation (4)). 𝑦𝑟−1 16 𝑦 = 𝑥1 ∗ (0.2 − 0.1 ∗ 𝑥 17 where y is weight of dropping leaves, yr is current growth year, x1 is aboveground biomass, x2 is 2 −1 ) (4) 1 number of years to maximum height and maximum LAI of trees (CHTYR). 2 3 Values and Ranges of Parameters Determined before Model Calibration 4 5 Accumulation of heat unit (HU) for a given day was calculated with the equation: 𝐻𝑈 = 𝑇̅𝑎𝑣 − 𝑇𝑏𝑎𝑠𝑒 when ̅𝑇𝑎𝑣 > 𝑇𝑏𝑎𝑠𝑒 (5) 𝑃𝐻𝑈 = ∑𝑚 𝑑=1 𝐻𝑈 (6) 6 7 where HU is the number of heat units accumulated on a given day, 𝑇̅𝑎𝑣 (℃) is the average daily 8 temperature, and 𝑇𝑏𝑎𝑠𝑒 (℃) is the temperature from which Populus starts to growth (TG). PHU is 9 the total heat units required for Populus maturity. The time that trees begin to develop buds and 10 maturity of seeds are considered the beginning and end of the growing season, respectively 11 (Neitsch et al. 2011). 12 Default values of RDMX, WAVP, BN1 (BP1), BN2 (BP2), and BN3 (BP3) in model are 3.5, 13 8.00, 0.0060 (0.0007), 0.0020 (0.0004) and 0.0015 (0.0003). These values have been used for 14 simulation of forest growth (MacDonald et al. 2008) and biomass of honey mesquite and eastern 15 red cedar (Kiniry 1998) and obtained reasonable simulation results. Thus, default values of 16 RDMX, WAVP, BN1 (BP1), BN2 (BP2), and BN3 (BP3) were used for Populus growth simulation. 17 Ranges and values of GSI were assumed as 0.004-0.007 and 0.007 for Populus (Kiniry 18 2014, personal communication). Ranges and values of HMX for hybrid poplar and cottonwood 19 were assumed as 7-15 (10-15) and 7.5 (10) (Kiniry 2014 personal communication). 20 HI ((leaf +stem dry weight)/total dry weight) of hybrid poplar is ranging from 0.4 to 0.6 21 (Michael et al. 1990). HI of Populus in model was calculated by dividing the weight of the harvest 22 portion of the plant by the weight of the total aboveground biomass (Arnold et al. 2011). Thus, 23 ranges of HI for hybrid poplar and cottonwood were calculated as 0.45-0.70 and 0.40-0.65. And 24 0.65 and 0.60 were determined as values of HI for hybrid poplar and cottonwood. 1 ALMANAC Model Calibration and Parameterization 2 Suggested ranges of WA and value of EXTINC for hybrid poplar were 58-64 and 0.6 from previous 3 hybrid poplar biomass modeling research (Landsberg and Wright 1989). However, since simulated 4 aboveground biomass of hybrid poplar were higher than observed values (Landsberg and Wright 5 1989), the initial values of WA and EXTINC were assumed as 45 and 0.6. 6 Observed DMLA, 8.6, was considered as initial value of DMLA for calibration (Hansen, 7 1983). Default value of CNP, 0.003, was used as initial value of CNP for calibration (Kiniry 2014, 8 personal communication). Suggested values of CNY, 0.001, was used as initial value of CNY for 9 calibration (Black et al. 2002; McLaughlin et al. 1987). Based on condition of canopy during 10 different periods of growing season, initial values of fraction of growing season coinciding with 11 the first and second point on optimal leaf development curve, and fraction of DMLA corresponding 12 to the first and second point were assumed as 0.05, 0.4, 0.05 and 0.95 (Zavitkovski 1981).


